This course will be updated or discontinued on or before Friday, March 3, 2028
Nationally Accredited
CEUFast, Inc. is accredited as a provider of nursing continuing professional development by the American Nurses Credentialing Center's Commission on Accreditation. ANCC Provider number #P0274.
Outcomes
≥ 92% of participants will know about the waveforms commonly seen on an EKG/ECG.
Objectives
After this course, the participants will be able to:
Describe abnormal electrical conduction through the heart.
Identify and relate unusual EKG/ECG waveforms to the cardiac cycle.
Determine key EKG/ECG arrhythmias.
Specify a systematic process when approaching the interpretation of the EKG/ECG.
Differentiate normal and abnormal components on an EKG/ECG.
CEUFast Inc. and the course planning team for this educational activity do not have any relevant financial relationship(s) to disclose with ineligible companies whose primary business is producing, marketing, selling, re-selling, or distributing healthcare products used by or on patients.
Last Updated:
$39 Unlimited Access for 1 Year (Includes all state required Nursing CEs)
No Tests Required (Accepted by most states & professions)
Nursing Assistants from California, only. You must read the material on this page before you can take the test. The California Department of Public Health, Training Program Review Unit has determined that is the only way to prove that you actually spent the time to read the course. Less
The human heart is an engineering marvel, beating 2-3 billion times and pumping 50-65 million gallons of blood over a 70–90-year life. Unlike skeletal muscle, the heart’s specialized muscle sustains continuous beats, with areas of the myocardium managing electrical signals for each cardiac cycle. These signals travel through contractile and conductive cardiac cells. At rest, myocardial cells are electrically negative inside, and the shifting of sodium and potassium ions creates changes detected by EKG/ECG tracings.
For the purposes of this training, the term electrocardiogram (EKG/ECG) will refer to the graphical recording of the heart's electrical activity. The designation EKG, derived from the German "elektrokardiogramm," is also professionally recognized and represents the same concept. In clinical practice, ECG and EKG may be used interchangeably (Singh, 2025b).
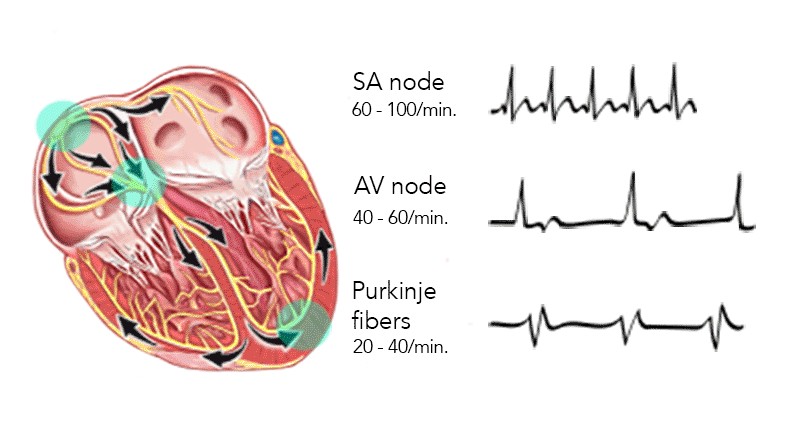
The sinoatrial (SA) node, also known as the sinus node, initiates a self-generated impulse independent of the brain (Kashou et al., 2022) and serves as the primary pacemaker, setting a rate of 60 to 100 beats per minute (bpm). The SA node is located at the border or junction of the superior vena cava and the right atrium. Once generated, this electrical impulse sets the rhythm of contractions and travels through both atria over a specialized conduction network to the atrioventricular (AV) node. The AV node is in the floor of the right atrium and receives the contraction impulse, which it transmits to the bundle of His. The bundle of His then divides the conduction pathway into a right bundle branch and two left bundle branches. These terminate in a complex network called the Purkinje fibers, which spreads throughout the ventricles. When the impulse reaches the ventricles, stimulation of the myocardium causes depolarization of the cells, and contraction occurs. The AV node serves as a gate to delay electrical conduction and, in this way, prevents an excessive number of atrial impulses from entering the ventricles (Clinical Gate, 2025).
Image 1 Cardiac Conduction System
The SA and AV nodes are supplied with sympathetic and parasympathetic fibers. These nodes enable instantaneous changes in the heart rate in response to physiological changes in oxygen demand.
Normal cardiac conduction occurs in this sequence:
The SA node initiates an electrical impulse, sending it through the atrium, causing an atrial kick, then to the AV node, bundle of His, right and left bundle branches, and finally to the Purkinje fibers into the ventricular muscle.
If the SA node falters, a hierarchy of backup pacemakers can take over. Atrial, AV node, and ventricular escape pacemakers can function as subsidiary pacemakers. However, they generate impulses at a much slower rate. The AV node generates rates between 40 and 60 bpm, and the Purkinje fibers at 20 and 40 bpm.
An electrical impulse does not always equal the contraction of the heart. Accessory pathways play a role in re-entry tachydysrhythmias, providing a detour for unwanted electrical impulses to circle through the heart.
Cardiac cells are immersed in, and contain within them, an ionic solution comprising sodium, potassium, and calcium. During the resting phase of the cell, the intracellular side of the membrane exhibits a negative charge, whereas the extracellular side is positively charged. The transmembrane movement of these ions produces an electrical current, which is responsible for generating the signal observed on an EKG/ECG (MacKinnon & Haque, 2025).
Resting cardiac cells have a negative charge because sodium ions (outside) are more positively charged than potassium ions (inside). This polarized state means the cell is ready to fire. When stimulated, potassium leaks out, causing depolarization and a positive charge inside the cell. The electrical impulse then spreads through the heart. Recovery, or repolarization, occurs when sodium and potassium return to their original positions via the sodium-potassium pump (Klabunde, 2023).
A normal cardiac impulse arises in the specialized pacemaker cells of the SA node, located about 1 millimeter (mm) beneath the right atrial epicardium at its junction with the superior vena cava (Hoagland, 2025). The impulse then spreads over the atrial myocardium to the left atrium via Bachmann's bundle and the AV node region via the anterior, middle, and posterior internodal tracts connecting the sinus and AV nodes. These represent the usual routes of spread but are not specialized tracts analogous to the Purkinje system. When the impulse reaches both atria, they depolarize electrically, producing a P wave on the EKG/ECG, and then contract mechanically, producing the wave of the atrial pressure pulse and propelling blood forward into the ventricles.
Conduction slows when the impulse reaches the AV node, allowing sufficient time for blood to flow from the atria into the ventricles (National Heart, Lung, and Blood Institute, 2025). After the impulse emerges from the AV node, conduction resumes rapidly through the bundle of HIS to the right and left bundle branches. It terminates in the Purkinje fibers in the ventricular muscle.
Stimulation of the myocardium causes progressive contraction of the myocardial cells. Therefore, wave deflections correspond to the cardiac cycle's mechanical events, including contraction and relaxation of the cardiac chambers. Repolarization is only electrical, and during that, the heart is at rest.
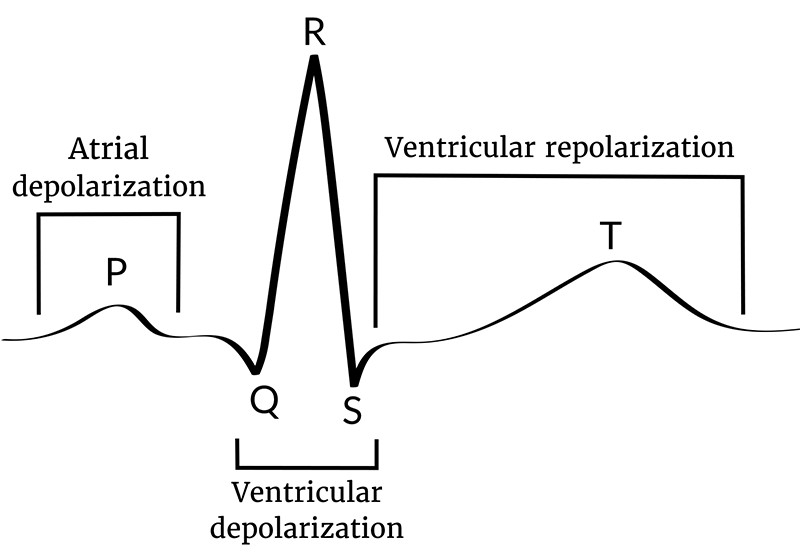
Three major waves of electric signals appear on the EKG/ECG. Each one shows a different part of the heartbeat (ACLS Medical Training, n.d.).
The first wave is called the P wave. It records the electrical activity of the atria.
The second and largest wave, the QRS wave, records the electrical activity of the ventricles.
The third wave is the T wave. It records the heart's return to the resting state.
Image 3: Diagram of the Cardiac Electric Cycle
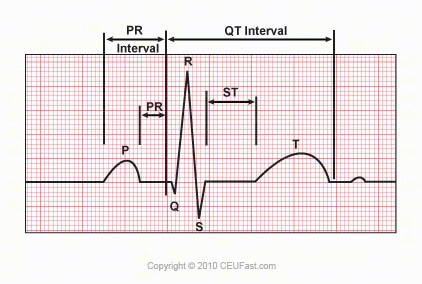
The P wave represents atrial electrical activation. The PR interval is the time from the onset of atrial activation to the onset of ventricular electrical activation. The QRS complex represents the ventricular electrical activation spike. The QRS duration is the length of ventricular activation. The ST-T wave represents ventricular repolarization. The QT interval is the duration of ventricular activation and recovery. The U wave, that little bump of mystery on the electrical tracing of heart activity, represents "after depolarization" in the ventricles (Cardiovascular Medicine, n.d.).
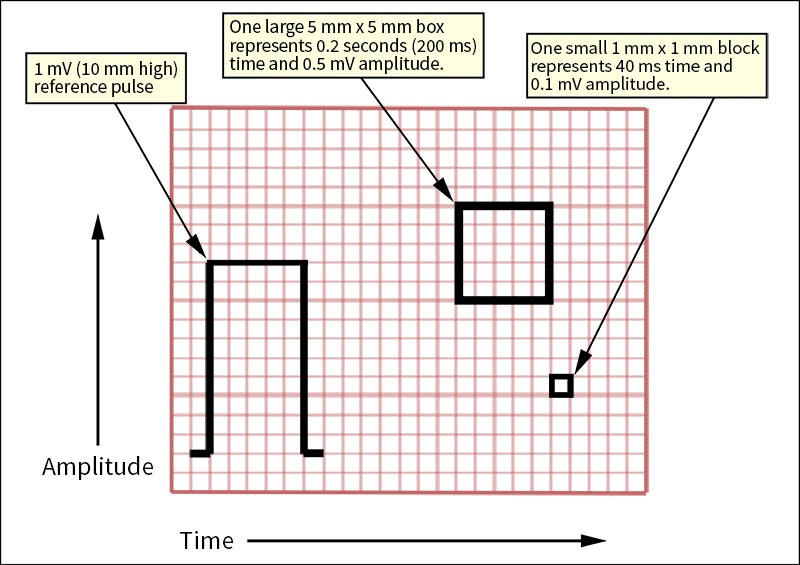
An EKG/ECG is a recording of the heart’s electrical output. This recording gives a visual index of the mechanical activity occurring with every life-giving beat. The background format of an EKG/ECG strip is a graphic field on what is known as electrocardiograph paper. An electrocardiograph tracing moves at a 25 mm/sec speed and is heat-inscribed onto the special paper as the horizontal X-axis. At the same time, electrical strength (voltage) is scribed onto the Y-axis (vertically). Each large square is 0.2 seconds long, so five large squares make up one second. Each 0.2-second square is further divided into five small squares of 40 milliseconds (ms) each.
EKG/ECG Paper Time vs. Voltage
Image 4: Paper Standards
Standard EKG/ECG grids where the horizontal axis represents time and the vertical axis represents voltage. With a rate of 25 mm/sec (or 40 ms per mm).
A small box is 1 mm × 1 mm and represents 0.1 millivolts (mV) × 0.04 seconds.
A large box is 5 mm × 5 mm and represents 0.5 mV × 0.20 seconds.
Voltage, or the strength of the heart’s electrical impulses, is represented on the vertical Y-axis. Each mV of positive electrical current raises the stylus 1 centimeter (cm). The waveform baseline or bioelectric line is electrically neutral, usually without any deflections, e.g., a flat line.
A P wave on an EKG/ECG represents atrial electrical release, or depolarization. This initiates a cascade or wave of electrical activity initiated by an impulse from the SA node and the following electrical spread (conduction) through the atria. The SA node is, physiologically, located in the right atrium, so the right atrium begins heart muscle constriction known as depolarization. This right atrium depolarization wave represents the first half of the P wave graphic. As depolarization spreads to and through the left atrium, we observe that process in the second half of the P wave graphic. The amplitude (height) is normally 0.05 to 0.25 mV (0.5 to 2.5 small boxes). Normal duration 0.06-0.12 seconds (1.5 to 2.75 small boxes). The shape of a P wave is usually smooth and rounded.
In leads I and II, the P waves should always be positive or above the baseline, whereas in lead aVR, in a normal sinus rhythm, they should be negative. And here is a teaser to whet your interest: when you see an abnormal P wave, consider strongly the presence of atrial changes, such as myocardial enlargement (Biology Insights, 2025).
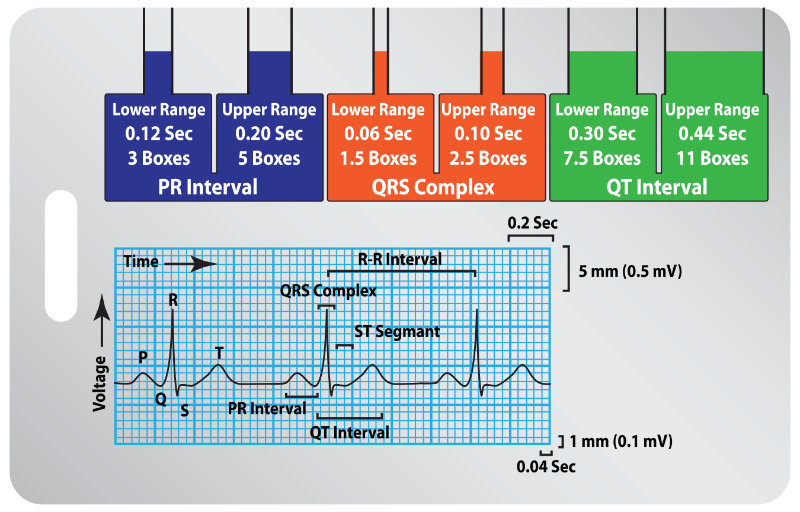
AV conduction time is the PR interval. It is the time from the start of atrial depolarization, the P wave, to the beginning of the QRS, or ventricular depolarization. The normal PR interval is three to five small squares or 0.12 to 0.20 seconds. Long PR intervals may indicate the presence of a first-degree atrioventricular (AV) block, while short intervals are often associated with disorders of AV acceleration, such as Wolf-Parkinson-White (WPW) syndrome (Cardiovascular Medicine, n.d.).
Q+R+S represents the beginning of ventricular depolarization until the end of ventricular depolarization.
This brings us to the QRS complex, a crucial portion of the EKG/ECG that illustrates ventricular depolarization—the momentous electrical event that triggers the contraction of the heart’s powerful lower chambers. The QRS complex is typically much steeper and sharper than the P wave, reflecting the rapid spread of the impulse through the ventricles. Normally, its duration should measure no more than three small squares or 0.12 seconds, emphasizing the swiftness of ventricular activation. Widened QRS complexes can suggest issues like bundle branch blocks (BBB) or ventricular rhythms. Each component of the complex, the Q, R, and S waves, carries unique significance (Cardiovascular Medicine, n.d.).
The duration of the entire QRS is less than 120 ms or equivalent to three small squares. An extended QRS might indicate the presence of a BBB or hyperkalemia. Early ventricular contractions (premature ventricular contractions or PVCs) are frequently associated with a wide QRS length. So, remember to count boxes in the QRS when you see those annoying PVCs.
The delta wave is a slurred upstroke in the QRS complex, signifying a condition of pre-excitation in the ventricles. Typically, it arises at the end of the P wave, making for a shortened PR interval. Most commonly, it is associated with WPW syndrome, where an accessory pathway can allow early excitation of the ventricles (Cadogan & Buttner, 2022).
Delta Wave
Image 5: Delta Wave, Lead II
Note the upward slope beginning at the end of the P wave, overriding the Q, and climbing up the forepart of the R.
The Q wave is the initial, tiny, downward, or negative deflection of ventricular depolarization and contraction. To be more exact, Q represents depolarization of the intraventricular septum, the membranous and muscular partition separating the right from the left ventricles of the heart.
The normal Q wave is small and easily missed. It is less than 25% of the R wave amplitude and does not exceed 0.04 seconds in duration, which is equivalent to one small box. Abnormal Q waves are a strong indication of the presence of an old myocardial infarction (Burns & Buttner, 2024a).
The S wave is the first downward or negative deflection after the R wave and represents the final depolarization of the Purkinje fibers in the ventricles (ACLS Medical Training, n.d.).
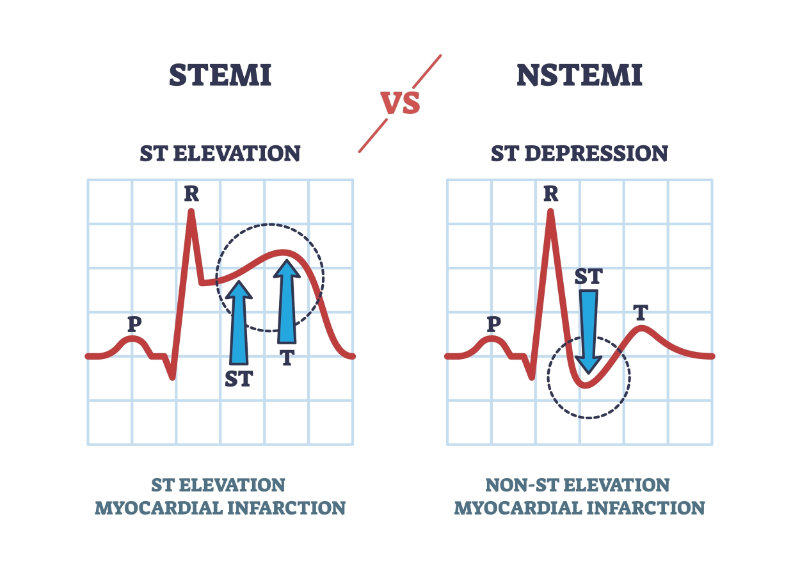
The ST segment is the electrical resting period after ventricular depolarization. It represents early repolarization of the left and right ventricles. This interval begins with the end of the QRS complex and ends with the onset of the T wave (Kashou et al., 2023). Its duration is two to three small squares, 80-120 ms, and its isoelectric charge should lie at the same height as the PR interval. This height comparison is important. ST-elevation can be an indication of acute myocardial infarction. Other heart conditions that are expressed in ST abnormalities include acute pericarditis, hyperkalemia, hypercalcemia, pulmonary embolism, ventricular aneurysm, left BBB, Prinzmetal angina, blunt trauma to the heart, Brugada syndrome, and even subarachnoid hemorrhage.
The T wave is the process of ventricular repolarization. T follows, after a short pause, the QRS complex (ACLS Medical Training, n.d.). The T should be less than two-thirds of the height of the R wave. T-wave morphology changes are seen in conditions such as hyperkalemia, hypercalcemia, endocrine changes, myocarditis, pericarditis, cardiomyopathy, pulmonary embolism, fever, generalized infections, anemia, acid-base disorders, and more.
U waves are small positive deflections that may be seen following the T wave. There is no clear consensus on what they represent; however, delayed repolarization of the tissue known as the papillary muscle or Purkinje fibers often occurs during the interval when they are seen (School of Health Sciences, n.d.).
The QT interval represents the total ventricular activity from ventricular depolarization to repolarization. There is no fixed “normal” for this period of length, though 400 to 440 ms has been suggested. It is measured from the beginning of the QRS complex to the end of the T wave, with slower heart rates having longer QTs (Lome, n.d.b).
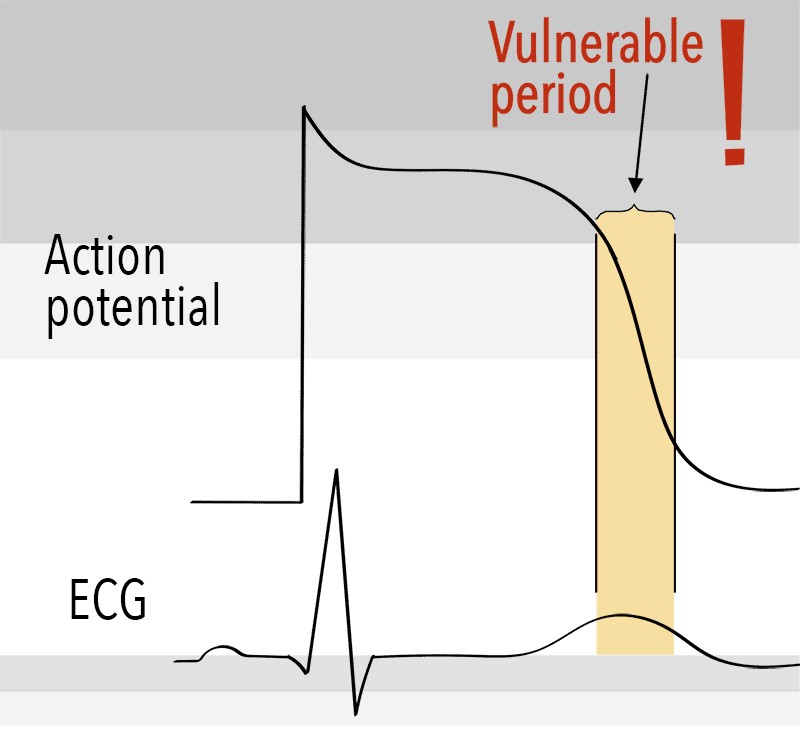
Prolonged QT intervals indicate a lengthened relative refractory period, a vulnerable period for abnormal electrical mischief. Inside this vulnerable period, critical, life-threatening rhythms may attempt to establish themselves, such as torsades de pointes, ventricular tachycardia (VT), or ventricular fibrillation (VF).
Osborn waves or J waves are seen mostly during hypothermia. This wave presents a small deflection at the junction, “J,” of the QRS complex and the ST segment (Cadogan & Buttner, 2025).
Congratulations if you encounter one—Epsilon waves are rare. They are a regularly occurring, small positive deflection buried at the end of the QRS complex. Most frequently associated with inherited heart disease from arrhythmogenic right ventricular cardiomyopathy (ARVC). First described in 1977, this condition is responsible for 11% of sudden cardiac deaths (SCD) in athletes (McKenna, 2024).
The standard heart monitor paper speed is 25 mm (five large squares)/sec. If the interval between two beats (R-R) is five large squares, the heart rate is 60 beats/min.
Rule of 300: Divide 300 by the number of the large squares between two heart beats (R-R), or, if the interval between two beats is one large square, the heart rate is 300 beats/min, two squares →150, three squares →100, four squares → 75, five squares → 60, six squares → 50 beats/min.
Image 8: Calculating Heart Rate
The six-second method: Count the number of complete R waves within six seconds and multiply that number by ten. This count is the one-minute heart rate. This method can be used when the rhythm is "regular” or “irregular" (Singh, 2025a).
The three-second method: Count the number of complete QRS complexes in three seconds and multiply that by twenty. This count is the one-minute heart rate.
The eight-step system is a good starter system, and you will quickly learn what to look for.
Step One: Determine the Rate
To determine the atrial rate, measure the distance between P-P and determine the rate by one of the methods listed earlier.
What is the ventricular rate?
To determine the ventricular rate, measure the distance between R-R.
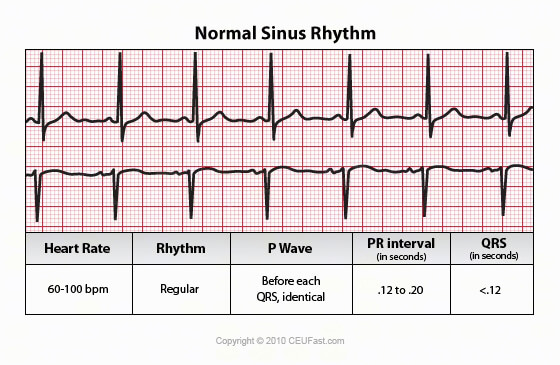
Note: The rate of a normal sinus rhythm is 60-100 bpm.
Step Two: Determine the Rhythm
Is the rhythm regular? Regular? Regularly irregular? Irregularly irregular?
Step Three: Evaluate P Waves
Are P waves present and uniform in appearance?
Are P waves upright (positive) in lead II?
Do P waves appear regularly before each QRS complex?
Is there more than one P wave before a QRS complex?
If irregular, is there an associated QRS?
Step Four: Evaluate the PR Interval
If the PR interval is less than 0.12 or more than 0.20 seconds, conduction follows an abnormal pathway, or the electrical impulse is delayed at the AV node.
The normal PR interval is 0.12 to 0.20 seconds.
Is the PR interval consistent?
Step Five: Evaluate the QRS Complex
Do the QRS complexes occur uniformly and look the same throughout the strip?
If the QRS measures 0.10 seconds or less, it is considered narrow and is presumed to be supraventricular in origin.
If the QRS complex is greater than 0.12 seconds or more, it is considered wide and presumed to be ventricular in origin until proven otherwise.
The QRS normally measures 0.04 to 0.10 seconds in duration. Determine if they are married to the P waves.
Step Six: Evaluate T Wave
Are T waves present?
Are T waves smooth and rounded?
Do they have a normal amplitude of 0.5 mV or less?
Is the deflection the same as the preceding QRS?
Is there a relationship between any ectopy to the T wave?
Step Seven: Evaluate the QT Interval
Is the duration from 0.36 to 0.44 seconds?
Step Eight: Evaluate Other Components
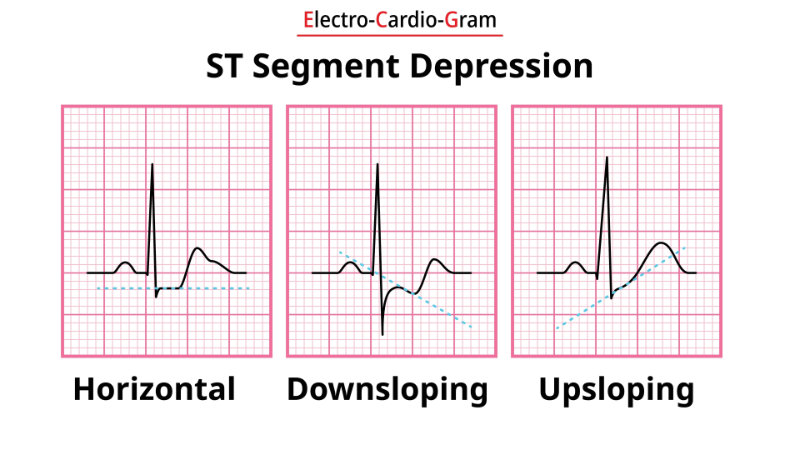
Is the ST-segment elevated? Depressed? Sloping or scooped?
The normal electrical flow through the heart originates in the SA node > AV node > bundle of His > left and right bundle branches > Purkinje fibers with mechanical (muscle) cells stimulated along the way. Therefore, the primary pacemaker is the SA node and has an inherent rate of 60-100 bpm. The SA node has the highest level of automaticity; however, emergency “escape” pacemakers exist.
Escape pacemakers are cells that initiate a heartbeat when the faster normal pace fails to descend along the standard conduction pathway. Escape cells exist in the AV junction and the ventricles.
The AV junction is the AV node and the nonbranching portion of the bundle of His. The pacemaker cells in the AV junction are located near the non-branching portion of the bundle of His (Burns & Buttner, 2024b).
The AV node should only generate an impulse if the SA node does not function at its normal rate. The AV node fires electrical impulses at a slower rate of 40-60 bpm.
Ventricular pacemakers in the bundle branches and the Purkinje network will become the initiating pacemaker if the AV node cannot function or the depolarization wave fails to descend. The inherent ventricular rate is 20-40 bpm.
EKGs/ECGs are all about depicting the energy use of the heart. To get a standardized view of electrical flow, the “angle” from which the flow is viewed is essential. A standardized placement pattern of EKG/ECG lead wires must be used to get consistent and usable data.
Understanding EKG/ECG lead placement begins with an appreciation for the heart’s complex rhythm generation and propagation. Each lead provides a unique perspective on the cardiac cycle, capturing the sum of electrical activity as it moves through the myocardium. A thorough understanding of the physiology of pacemaker cells, conduction pathways, and rhythm disturbances provides the foundation for interpreting EKG/ECG tracings.
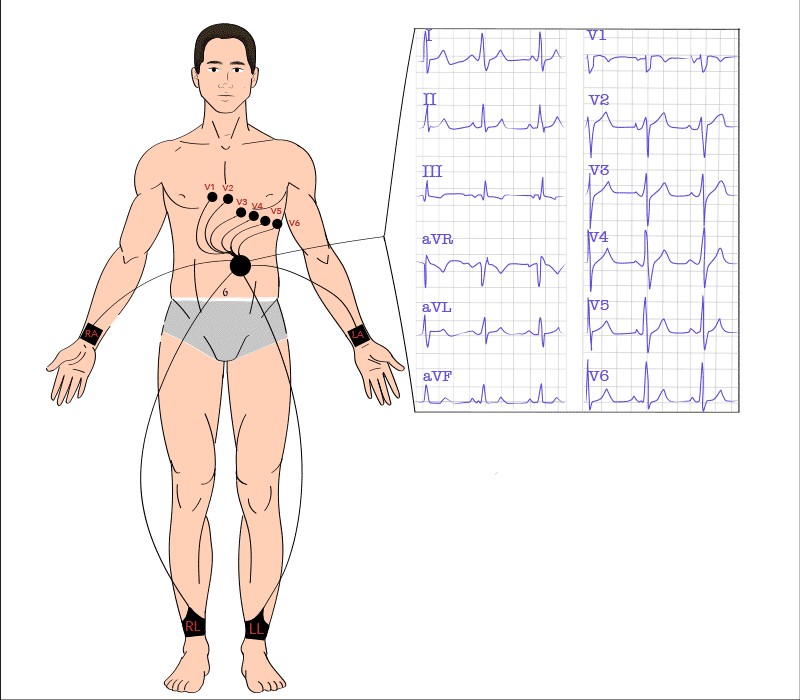
The industry standard in healthcare is the 12-lead EKG/ECG, of which there are 10 electrodes with wires, only 9 of which receive information. Have I made any engineering remarks yet? You do get 12 distinct readouts, however. The marvels of science.
Additionally, a 12-lead may not typically be used for monitoring a patient. For ongoing patient care, including pre-admission work by emergency responders, a three-lead configuration of foam-backed sticky electrodes is used, with limb lead II being considered the view of choice.
Back to 12-leads. One wire is a grounding wire and contributes only to patient safety in the process. The remaining leads, or more accurately, tracings, consist of ten wires, resulting in three standard leads (formerly known as limb leads), three augmented leads (also known as Goldberg leads), and finishing with six precordial leads (Wilson’s chest leads) for a complete 12-lead EKG/ECG report. Let me just mention that William Einthoven developed the practical EKG/ECG in 1902, earning a Nobel Prize. His triangle, now known as the limb leads and later as the standard leads, remains central to recording heart activity in leads I, II, and III (Lee, 2025).
Lead I:
The electrode is often placed just below the left clavicle instead of the traditional left arm.
Provides information about the left lateral wall of the chest.
Lead II:
Electrode near the left leg (typically placed below the left pectoral muscle).
Provides information about the inferior wall of the heart.
Common in cardiac monitoring because the position of view for this lead is close to the heart’s actual conduction pathways.
Lead III:
Provides information about the inferior wall of the heart.
Using the same placement of three-electrode pads and a little fancy math, we can get different views of the electrical activity in the heart. These are known as augmented limb leads, Goldberger leads, unipolar limb leads, or just unipolar leads. An EKG/ECG can create an augmented theoretical null point in the center of Einthoven’s triangle, allowing a view of the absolute potential in each electrode (Horoba, 2025).
Sounds a little esoteric? Well, it is all about the angle, or vector, from which you are looking at the heart. Think about standing at the end of an extremity, right arm, left arm, or feet, with the feet lying side by side. Now squint up at the heart along that axis. Electric waves moving away from your position will have a positive amplitude on the EKG/ECG strip. The waves are moving toward you, a negative deflection. Electrical events that do neither will be minimized, blended into the baseline (Horoba, 2025).
The augmented leads are named aVR, aVL, and aVF. “A” for “augmented,” “V” for “voltage,” then “Right,” “Left,” and “Foot.” The leading “A” can be lower case or capitalized, though the lower case is technically correct.
Lead aVR:
The augmented unipolar right arm lead is oriented toward the cavity of the heart.
Electrical current from the heart is traveling towards the right arm.
All deflections of the EKG/ECG, P, QRS, and T should be negative in this lead.
Lead aVL:
The augmented unipolar left arm leads oriented toward the heart, facing the anterolateral aspect of the left ventricle.
Electrical current from the heart is traveling towards the left arm.
Lead aVF:
The augmented unipolar left leg lead (feet). It is oriented toward the inferior surface of the heart.
Electrical current from the heart is traveling toward the feet.
Standard leads, plus augmented leads, make up the first six of a 12-lead EKG/ECG. Surprise! These first six share one important characteristic: they all view the heart from the frontal plane, as though the patient is lying prone and their heart flat on the top of a table we are looking across. Oh, if we could only see the heart's activity from the horizontal plane, as though we were looking straight through our patient!
Well, with math, we can. Welcome to the six precordial leads.
The precordial, or chest leads, view the heart's electrical conduction from a straight face-to-face view. These leads, referred to as “V” leads, or Wilson’s chest leads, are horizontal plane, unipolar leads.
Lead V1:
Anterior view of the right ventricle and right atrium.
Faces the heart cavity.
Provides an electrical view of the right ventricle.
QRS is mostly negative in this lead.
Lead V2:
Anterior view.
Provides an unobstructed view of electrical activity in the right ventricle.
QRS is mostly negative.
Lead V3:
View of the heart's sternocostal surface.
Lead V4:
Septal view and left ventricle.
QRS is mostly positive.
Lead V5:
Lateral view of the septum and left ventricle.
QRS is mostly positive.
Lead V6:
Lateral view of the septum and left ventricle.
QRS is mostly positive.
There are additional uncommon, used for special situations, lead patterns out there. Just so you are aware.
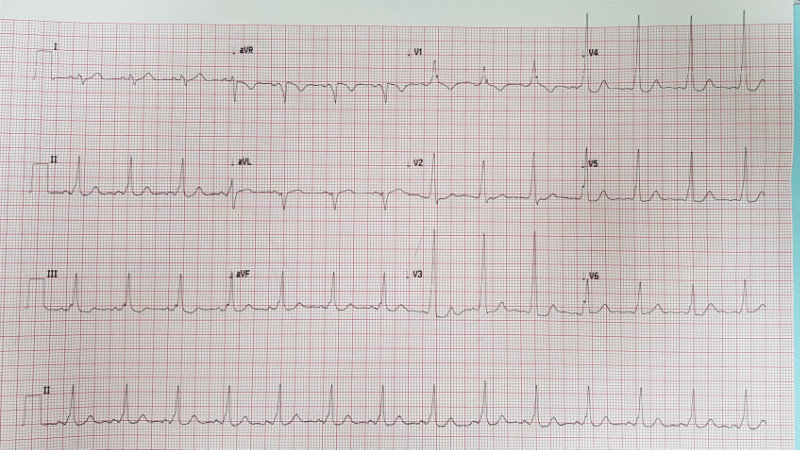
An EKG/ECG strip displays a single-lead reading from a monitor, while a 12-lead sheet provides diagnostic information from 12 different perspectives. Abnormalities unnoticed in one lead may be visible in another.
Quick trick. However, different manufacturers of EKG/ECG machines produce various-looking EKG/ECG sheets; a standard print format is employed.
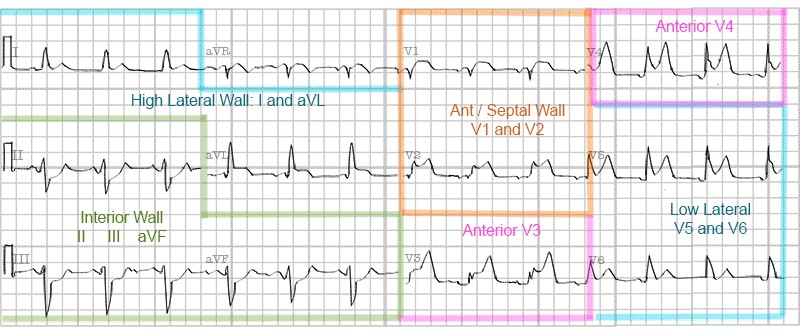
Relative Positions of 12-Lead Results on EKG/ECG Paper
Lead I
Lead aVR
Lead V1
Lead V4
Lead II
Lead aVL
Lead V2
Lead V5
Lead III
Lead aVF
Lead V3
Lead V6
Long length focus lead, either designated by an operator or picked by a machine.
The default long lead tends to be standard lead II.
Knowing this table allows you to always recognize which lead you are looking at on any given EKG/ECG sheet.
Regularity is a fundamental factor for functional heart rhythms. The rate of conduction, whether it is too slow or too fast for adequate blood perfusion, is also essential for effective cardiac function. Additionally, the composition of each heartbeat is important; effective pumping ensures that blood moves forward efficiently, while ineffective efforts can reduce cardiac output. Assessment focuses on P waves, QRS complexes, and T waves to evaluate these functions quickly and effectively.
Regularity is measured using EKG/ECG graph paper. Typically, a single off-timing beat is notable but not usually concerning. Multiple irregular beats may indicate underlying issues and should prompt further evaluation. This applies to beats originating from the atrium, junctional region, or ventricles.
The heart's pumping ability depends on its rate. The standard is 60–100 bpm; rates below this range can reduce cardiac output, while higher rates can compromise consistency of blood flow. The origin of any rate abnormality is significant, as the heart attempts to compensate for impaired pumping capacity (King & Lowery, 2023).
Inadequate filling of the heart chambers can lead to a rapid decline before ventricular contraction fails, potentially resulting in congestion. Abnormal QRS complexes are indicative of incomplete contraction. What is observed electrically on the monitor corresponds to physiological outcomes that impact patient health. Early detection, investigation, and appropriate treatment are associated with improved outcomes.
Definition: Aberrancy
Aberrancy on an EKG/ECG refers to the abnormal conduction of electrical impulses in the heart, resulting in irregular patterns that may be associated with various cardiac conditions. Recognizing these patterns supports accurate diagnosis and management.
Aberrancy can result from mechanisms such as a BBB or accessory pathways. BBBs occur when there is a delay in one branch of the bundle of His, while accessory pathways provide additional electrical connections, altering normal conduction.
Aberrancies can reflect underlying structural or functional cardiac abnormalities. Detecting aberrant conduction patterns on an EKG/ECG allows healthcare providers to evaluate cardiac function and plan appropriate interventions.
Heart patterns involve rhythm, rate, and aberrancy (Nickson, 2024).
Image 12: Normal and Pathological EKGs/ECGs
Cardiac rhythms are controlled by the loci of the highest magnitude, fastest, and strongest cadence. This will be doubly important when we discuss pacemakers. At the core, there are three basic heart rhythms.
Basic Cardiac Rhythms
Image 13: Basic Rhythms, Lead II
Sinus rhythm (impulses are generated by the SA node).
Junctional rhythm (impulses are generated by the AV junction).
Ventricular rhythm (impulses are generated by Purkinje fibers in the ventricles).
Because the SA node generates impulses with the highest magnitude, it has overdrive suppression over all heart tissue. The SA node is referred to as the primary pacemaker, the cadence setter.
A normal heartbeat is triggered by the SA node in the upper right atrium, producing a regular rhythm of 60 to 100 bpm (King & Lowery, 2023). This normal sinus rhythm adjusts to the body's needs, increasing or decreasing with activity or rest.
Image 14: Normal Sinus Rhythm, Lead II and V1
Sinus Beats
Any beat is fine if it originates in the atrium of the heart, right?
Oh, you are not going to let me get by making a bold-faced provocation statement like that, are you?
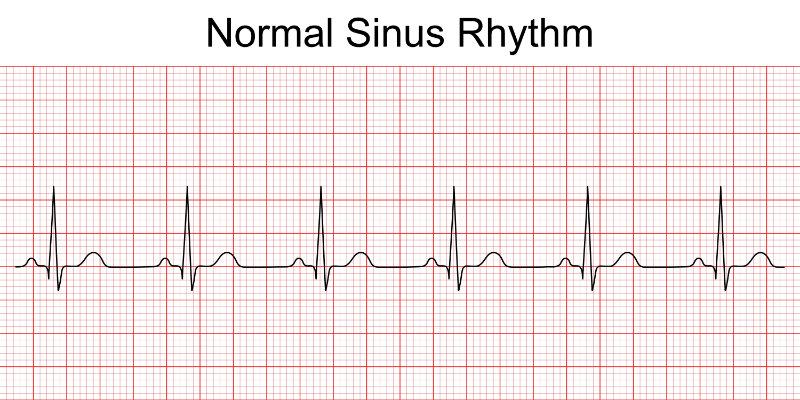
Normal Sinus Beats
Image 15: Normal Sinus Rhythm
Regular P waves marching along.
Nice, full-heart contractions, beautiful heart-chamber filling times. There is nothing more satisfying than watching the parade of regular, well-formed cardiac cycles, of which each of us should experience one to two billion in our moderate-length, purposeful lives.
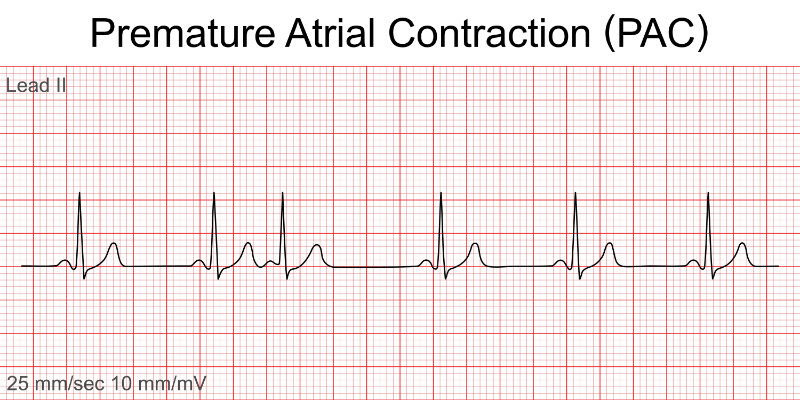
A Premature Atrial Contraction Beat
Image 16: Premature Atrial Contraction
Early QRS.
Absent or malformed proceeding P.
Note the following normal PQRS.
What is this! An early QRS means inadequate filling of the ventricular heart chambers. Should it happen too often, we face syncope, poor cardiac perfusion, anxiety, shortness of breath, and increased chances of provoking other less benign arrhythmias. More on that when we chat about supraventricular tachycardias.
Sinus bradycardia is a regular rhythm originating from the SA node that is slower than 60 bpm. In sinus bradycardia, the P vector on the EKG/ECG will be consistent with a SA node origin.
Atrium P Complex
EKG/ECG P Complex
Image 17A: Normal P Morphology, Lead II
Image 17B: Normal P Morphology, Lead II
P1 is right atrium.
P2 is left atrium.
Fires from SA node.
P1 slightly faster.
P1 manifests first.
P2 follows quickly.
Lead II is being represented.
Just as a reminder, a normal SA-produced P wave will show right atrial depolarization followed rapidly by left atrial depolarization. A distinctive right-to-left, top-to-bottom atrial progression gives rise to the stereotypical upright P inflection in leads I, II, and aVL, with a negative P deflection in the aVR lead (Singh, 2024).
Image 18: Sinus Bradycardia, Lead II and V1
Video licensed from
The slower conduction of sinus bradycardia may be due to a normal response to sleep or deep breathing in a well-conditioned athlete. Abnormal drops in rate could be caused by diminished blood flow to the SA node, vagal stimulation, hypothyroidism, increased intracranial pressure, or pharmacologic agents, such as digoxin, propranolol, quinidine, or procainamide.
Consider a slow heart rate if dizziness, fatigue, or syncope occur. Sinus bradycardia may have no symptoms.
A 12-lead EKG/ECG or a wearable (Holter) heart monitor is considered diagnostic of sinus bradycardia.
Too fast a heart rate while at rest creates problems with heart filling. The large chambers of the heart, the ventricles, require a full second to fill with blood in anticipation of pushing it out on its voyage through the body. A contraction rate of greater than 100 bpm with the electrical stimulus arising from the SA node and the presence of evenly paired P with QRS waves qualifies as sinus tachycardia.
Image 19: Sinus Tachycardia, Lead II and V1
Video licensed from
There are several types of tachycardia. Sinus tachycardia is a regular cardiac rhythm that meets normal sinus rhythm standards, apart from being too fast. Greater than 100 bpm in a resting adult, faster than 150 bpm in infants, up to around six years old (Henning & Krawiec, 2023).
Do not be misled. Too quick a heart rate, even with a normal conduction mechanism, can be problematic. Strokes, heart failure, and the risk of heart attack from increased cardiac demands can accompany sinus tachycardia.
Be warned, sinus tachycardia is known as a secondary symptom. When seen, it is a sign that something else is awry. When sinus tachycardia is seen, begin searching for the cause, the irritant that provokes the fast pace.
Sinus tachycardia may result from stress, exercise, pain, fever, pump failure, hyperthyroidism, caffeine, nitrates, atropine, epinephrine, isoproterenol, nicotine, electrolyte imbalances, fatigue, blood loss, and other situations that place stress on the body.
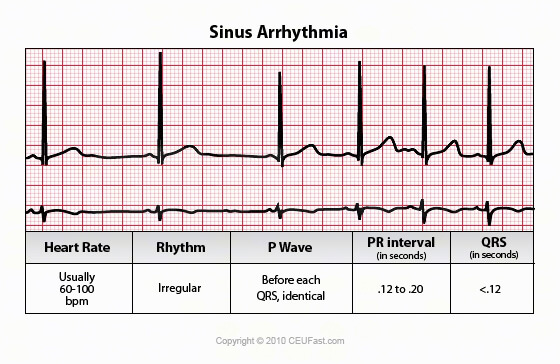
Healthy sinus arrhythmia occurs when a strong cardiac system, influenced by the vagal nerve, causes the heart rate to slow slightly during inhalation and speed up during exhalation (Soos & McComb, 2022). It is common in both children and adults, non-harmful, and does not require treatment.
Image 20: Sinus Arrhythmia, Lead II and V1
The primary concern with sinus arrhythmia is the potential for misdiagnosis as a more serious form of arrhythmia. Heart rate typically ranges from 60 to 100 bpm, though transient deviations may occur. If heart rate presents clinical challenges, rate-specific interventions should be considered.
A distinct P wave will be associated with each QRS complex. Be sure to look at your patient’s overall condition and, if in doubt, a 12-lead EKG/ECG should clarify the situation.
A sinus pause differs from a sinus arrhythmia. It reflects SA node dysfunction, causing missed or paused heartbeats when electrical impulses fail to exit the SA node. While symptoms can vary from mild to severe, these pauses should not be ignored, as they may progress to a potentially dangerous sinus heart block.
To qualify as a sinus pause, the space between P waves should last at least two seconds (Miller, 2023). Sinus pauses and arrests are most frequently observed in older patients due to progressive SA node deterioration, though this is difficult to confirm without controlled studies. In younger individuals, sinus arrest typically results from a specific cardiac event or a severe electrolyte imbalance. Symptoms may include occasional missed beats, fatigue, dizziness, or angina.
Differentiate between a sinus pause and a sinus arrest by seeking a substitute rhythm intervention. A sinus pause will be followed by a substitute rhythm interposing. Sinus arrest has no substitute rhythm.
Image 21: Sinus Arrest, Lead II and V1
The rate is typically 60–100 bpm, but can vary. The EKG/ECG shows an irregular rhythm due to the SA node impulse blocking before it leaves the node, causing the PQRST complexes to be missing. In sinus arrest, pauses are not multiples of other P-P intervals. Treatment may involve atropine or a pacemaker if symptoms appear.
Sinus exit blocks occur when a depolarization wave leaves the SA node but is not conducted through the atria, so the ventricles are not stimulated. Delays in SA depolarization initiating the heartbeat can also appear as AV blocks, which are classified into three main types—these will be discussed later (Kashou et al., 2022).
SA node conduction failure is serious. It can cause abnormal P waves followed by normal QRS complexes, or a total absence of P waves (sinus arrest), where backup pacemaker cells take over. Sinus arrest may result in bradycardia, dizziness, fainting, or palpitations since escape beats are slower than normal impulses.
Sinus Exit Block - Sinoatrial Block
Image 22: Sinoatrial Block
Heart Rate
Rhythm
P Wave
PR Interval
QRS
60-100
Irregular
P before every QRS
12-20 sec
< 10
Typically, this rhythm ranges from 60 to 100 bpm, but it can be slightly higher or lower. The pattern is irregular. Different cells in the SA node generate each impulse; however, some impulses are blocked before exiting the node. This leads to occasional missing PQRST complexes. The pause during these absences matches the interval between two P-P intervals of the underlying rhythm. Each PQRS appears uniform and upright in leads I, II, and aVL.
Expanding out into the heart atrium, we begin to see some common arrhythmias that present challenges to us as health professionals. Premature beats of any type can be problematic, and patients who report the feeling of skipped heartbeats need to be assessed for premature beats.
Premature atrial contractions (PACs) originate from early depolarization in the atrium outside the SA node, disrupting the normal heart rhythm (Heaton & Yandrapalli, 2023). These impulses often arise from irritation, inflammation, or unexplained triggers, causing an early atrial contraction. This results in a premature beat with an abnormal P wave and a mostly normal QRS complex.
Premature beats are classified by their origin: atrial, junctional, or ventricular. PACs happen when an atrial site fires before the SA node's scheduled discharge.
Image 23: Premature Atrial Complexes, Lead II and V1
Video licensed from
Aberrantly conducted PACs have a wide complex due to unusual conduction. PACs and other early beats can appear as couplets, bursts (premature atrial tachycardia), or bigeminy. Without other heart issues, the rate usually remains normal (60-100 bpm) with occasional PACs, but sinus tachycardia may increase their frequency. Early PACs make the rhythm irregular.
The P wave of a premature beat appears earlier and differs from those generated by the SA node, often appearing flattened, notched, or hidden in the preceding T wave detail, best seen on a 12-lead EKG/ECG. The PR interval varies from 0.12 to 0.20 seconds, depending on the pacemaker's proximity to the SA node; longer intervals suggest a higher initiation site, while shorter intervals indicate a site closer to the AV node. The QRS complex is typically less than 0.10 seconds but can be wider.
Definition: Accessory Pathway
An accessory pathway refers to an atypical electrical connection, typically congenital, situated between the atrium and ventricle. The conduction of electrical impulses through this pathway may occur in an anterograde direction (toward the ventricles), a retrograde direction (toward the atria), or both.
The presence of accessory pathways can contribute to atrioventricular reentrant tachycardia (AVRT) via a reentry circuit involving the AV node, as well as other tachyarrhythmias where abnormal atrial impulses are transmitted through the pathway, such as pre-excited atrial fibrillation.
Tachycardia means fast. Supraventricular means the origin of the impulses is from above the cardiac ventricles, more accurately, above the bifurcation of the bundle of His. That means the entirety of both atria and the AV junction. High and fast, aberrant rhythms are typically grouped together because they exhibit similar features.
Supraventricular tachycardia (SVT) is a group of regular fast rhythms characterized by narrow QRS complexes and high heart rates. Please note that while atrial fibrillation and atrial flutter share a high conduction origin point and fast rate, they are typically irregular rhythms and will be discussed later.
According to Farkas (2025), women are at least twice as likely as men to experience SVT. The symptoms of SVT are often misinterpreted as panic attacks; employing EKG/ECGs may assist in confirming the diagnosis. Polyuria is noted as a less common symptom.
SVT may occur spontaneously or result from triggers like excessive energy drink intake, cocaine use, sepsis, dehydration, or elevated intracardiac pressures. Cardiac conditions such as heart failure, myocardial infarction, pulmonary embolus, and valve disorders can also induce SVT.
Treatments include vagal maneuvers (such as carotid massage, Valsalva maneuver, and cold immersion) and medications that reduce AV node sensitivity, including adenosine, verapamil, esmolol, calcium channel blockers, digoxin, amiodarone, beta-blockers, and diltiazem (Gugneja, 2024).
Definition: Frog Sign
The “frog sign” is a clinical clue seen during atrioventricular nodal reentry tachycardia (AVNRT), where atrial contractions against a closed tricuspid valve produce strong jugular pulsations, known as “cannon waves,” creating a billowing appearance in the neck.
Although not an EKG/ECG finding, cannon waves may cause deviations on a 12-lead EKG/ECG.
Cannon waves and, less often, the frog sign can also appear in VT, but a wide QRS complex usually reduces back pressure and makes the frog sign less evident.
As we examine the anatomical structure of the heart and its electrical conduction pathways, we progress from simple cardiac arrhythmias to more complex and severe abnormalities. As electrical impulses follow the conduction system and initiate muscle contractions within the heart, conduction issues tend to increase in complexity and seriousness.
SVTs are categorized into two basic types: regular and irregular. SVT refers to the interval of QRS frequency. Fast, regular rhythms originating in the atrium of the heart are AVNRT, AVRT, and junctional tachycardia.
Of the regularly paced SVTs, AVNRT is the most common (Alvarado, 2025). Female patients comprise 70% of all AVNRT cases.
AVRT is a condition most common to young people and is the next most frequent of the SVTs. Typically, both SVTs occur due to circular electrical conduction between the atria and the ventricles. In AVNRT, two separate, parallel conduction pathways are present in the AV node: a slow conduction pathway and a fast one. When two pathways occur, there is a chance of a reciprocating re-entry stimulus occurring during cardiac stress. In AVRT, the AV node interacts with an accessory pathway that provides it with an untimely depolarization signal. This interplay establishes a circular trigger, keeping one depolarization working its way around through the AV node like a hula hoop of cardiac constriction.
AVRTs are the second most common of the regular SVTs and share with the SVTs what is often referred to as a pre-excitation syndrome. That is regular, rhythmic, rapid-firing stimuli originating from above the ventricles and AV nodes.
Atrioventricular Reentry Tachycardia
Image 25: Atrioventricular Reentry Tachycardia
Heart Rate
Rhythm
P Wave
PR Interval
QRS
150-250
Regular
Non-sinus P waves occur after QRS retrograde II, III, AVF
Hard to see, 0.12-0.20
Narrow < 0.12
The direction of the circular conduction pathway can influence outcomes. The most frequently observed circuit is an antegrade conduction pathway through the AV node, referred to as orthodromic. Orthodromic typically presents with the RP interval being less than the PR interval, or with the RP interval greater than the PR interval in cases involving a slow-conducting accessory pathway. Retrograde P waves may be seen in leads I, II, III, aVF, and V1. If the heart rate is below 100 bpm, a delta wave can be present, but this occurs only at normal sinus rhythm rates, not during tachycardia. The image above demonstrates the more common presentation of orthodromic AVRT.
Image 26: Cardiac Electrical Conduction Chain of Events
Retrograde conduction through the AV node is referred to as antidromic AVRT.
The aberrant rapid conduction flows down from the atrium through the accessory pathway. At that point, it regurgitates back up into the atrium from the depolarizing ventricles, flowing in the wrong direction through the AV node. Then the atrium fires and sends another aberrant depolarization down through the accessory pathway to the ventricles, repeating the aberrant conduction. Antidromic AVRT is a much less common conduction issue that possesses a distinct set of characteristics, including a short RP interval (< 100 ms). A regular, wide QRS complex (≥ 120 ms). Delta waves, the upslurring of the R wave, can be seen at rates equivalent to normal sinus rhythm and tachycardia (Knight, 2025).
Let us look at antidromic AVRT on a 12-Lead.
Antidromic Atrioventricular Reentry Tachycardia
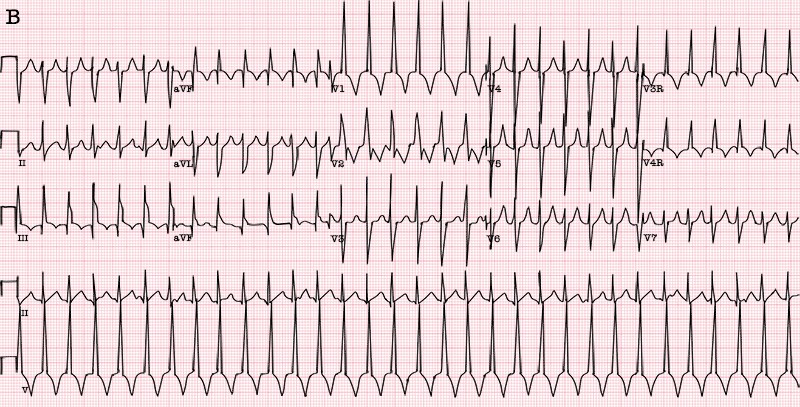
Image 27: Antidromic Reentry Tachycardia, 12-Lead
Heart Rate
Rhythm
P Wave
PR Interval
QRS
150-250
Regular
Retrograde and before QRS
Long
Wide > 0.12
Antidromic AVRT accounts for approximately 5% of all cases of AVRT. Delta waves are clearly visible in leads V4, V5, and V6 (Farkas, 2025). The P wave merges with the QR complex in leads I and II.
Additionally, WPW syndrome represents another form of accessory pathway reentrant rhythm. WPW is characterized by the presence of an accessory pathway and does not primarily involve the atrium; its detailed discussion will occur separately. On rare occasions, the accessory pathway in WPW may function such that the AV node serves as the retrograde pathway. These presentations typically feature a wide QRS complex, regular rhythm, and extremely rapid tachycardia (Farkas, 2025).
The bundle of His was mentioned earlier; however, time was not spent discussing what a great divider it is. Recall that the heart's electrical activity begins in the SA node (the heart's natural pacemaker), situated on the upper right atrium. The contraction stimulus travels around through the right atrium, then simultaneously through the left atrium, and finally triggers the AV node. From the AV node, the electrical impulse travels down the bundle of His, and here is the good part: it separates into the right and left bundle branches. The right bundle contains one fascicle (pathway, tract, nerve cable). The left bundle branch subdivides into two fascicles: the left anterior fascicle and the left posterior fascicle. Some academicians say that only some people possess the left septal (median) fascicle (Goldberger, 2024). The fascicles, however many you see in the heart, go on to fragment into millions of Purkinje fibers, which interrelate with cardiac myocytes (muscle cells), allowing rapid coordination and synchronous physiological depolarization and contraction of the ventricles.
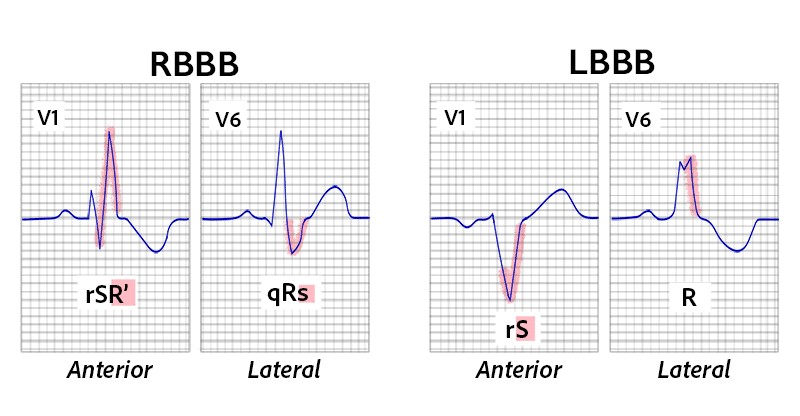
So, what happens when a bundle branch gets constipated, stopped up, blocked? Welcome to the BBBs. In BBBs, the QRS complex will become wide, lasting more than 120 ms. This is due to whichever side is blocked; the depolarization stimulus to that ventricle will be delayed, as it is forced to propagate to that ventricle by means other than the nerve bundle leading into the ventricle from the bundle of His. As a rule, upward deflection on the EKG/ECG indicates the electrical impulse is heading towards the physical lead you are viewing it in. This means, diagnostic shortcut here, look at the V1 lead (V6 as the opposite view can be used to confirm). Should the abnormally wide QRS be deflected downward in direction, the left bundle is blocked. When the abnormally wide QRS in V1 is deflected upward, the right bundle is blocked.
Hint: Go over this in your head a few times, and trace it out. This will save you considerable time later in real life.
Right BBB in V1 QRS has an “M” shape, with the second rabbit ear larger.
Right BBB in V6 has a “fat” S wave (> 40 ms) with a QRS “W” shape.
Anatomical quirk here. The left side of our hearts is meatier and more muscular than the right. So, depolarization of the muscle has a greater influence on the EKG/ECG strip. When the left and right ventricles depolarize simultaneously, normally, a uniform R wave of less than 120 ms appears on the rhythm strip. BBBs force the QRS to widen.
BBBs can be considered complete or incomplete blocks, depending on the causative factors. In general, the QRS of a complete block will be wider than that of an incomplete block.
Right BBB is the most common (Harkness & Hicks, 2023). At its heart, it often occurs with near-catastrophic cardiac insults (myocardial infarction, myocarditis, holes in the heart chambers, chest trauma) or severe lung issues (pulmonary embolism). When you see it start, look for what is provoking the heart block, although it can be potentially benign.
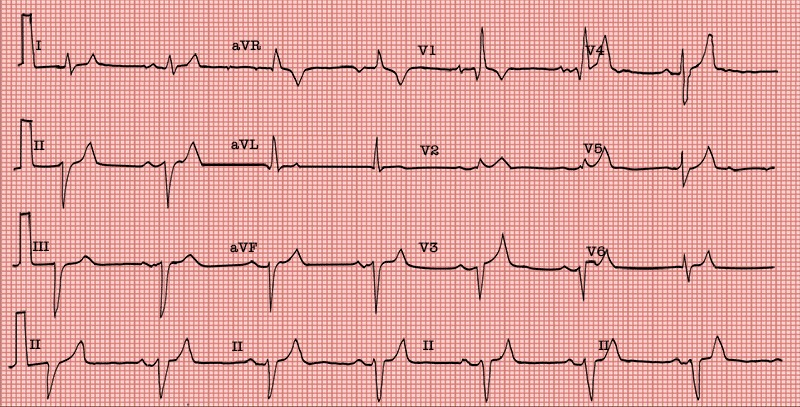
When a bundle is blocked in the left ventricular fields, look for a broad QRS complex greater than 120 ms. In V1, the S wave will be prominent. The R wave will be wide in leads I, aVL, V5, and V6, and prolonged in V5 and V6. Additionally, in lateral leads, Q waves will be difficult to spot (Lome, n.d.a).
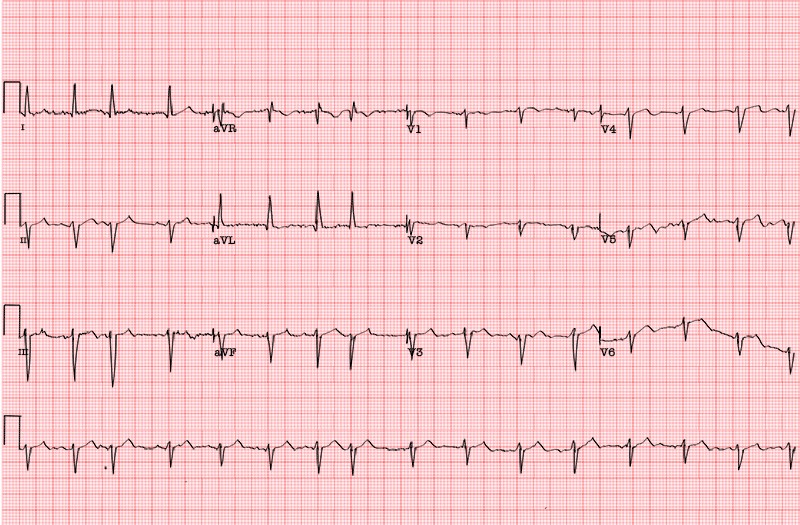
Bifascicular block is a conduction delay in two of the three main fascicles of the heart's conduction system, often presenting as right BBB combined with either left anterior fascicular block or left posterior fascicular block (Sauer, 2025). When significant myocardial changes are spotted, they are afoot. Consider preparing for pacemaker insertion even while the investigation into the underlying causes of the block is underway.
Bifascicular Block
Image 30: Bifascicular Block, 12-Lead
Overall heart rate = 38 bpm.
PR interval is 0.28 seconds, or 280 ms.
QRS is wide, just over 120 ms.
Wide S in leads I and V6.
Note the extra slight wave at the end of each QRS. This is what is known as a “terminal delay,” which indicates late repolarization in the right ventricle.
Recall what late repolarization in a ventricle is associated with? Yes, bundle blocks.
This EKG/ECG also shows a left anterior fascicular block, also called left anterior hemiblock. The left bundle usually has two main branches, the anterior-superior and the posterior-inferior. EKG/ECG criteria for left anterior fascicular block are left axis deviation with a small R wave in lead III and a small Q wave with tall R waves in leads I and aVL. There is also a prolonged R-wave peak time (> 45 ms) in aVL. There is usually a slightly prolonged QRS, but in this case, the QRS is widened due to the right BBB. Because the right bundle branch is blocked, and one fascicle of the left bundle is blocked, the patient is said to have a “bifascicular block.” Only one fascicle remains available for conduction from the atria to the ventricles.
Case Study
What we know about this patient – see 12-Lead EKG/ECG above (Bifascicular Block) – is that they are male, 75, suffering from syncope. The EKG/ECG shows sinus bradycardia at a rate of just under 40 bpm.
What we find is that in the two left bundles, the left anterior is blocked, called a left anterior hemiblock. EKG/ECG criteria for left anterior fascicular block are left axis deviation with a small R wave in lead III and a small Q wave with tall R waves in leads I and aVL.
There is also a prolonged R-wave peak time (> 45 ms) in aVL. There is usually a slightly prolonged QRS, but in this case, there is widening of the QRS due to a right BBB.
Because the right bundle branch is blocked, and one fascicle of the left bundle is blocked, the patient is said to have a “bifascicular block.” Only one fascicle remains available for conduction from the atria to the ventricles.
The plan: Pacemaker, before more heart function fails. Also, yet secondary, find why the three blocks and correct that situation.
First-degree AV Block
Right BBB
Left anterior hemiblock
Outcome: This is an actual patient, and we thank the contributor of this EKG/ECG. An AV sequential pacemaker was promptly implanted with wonderful results. No more syncope and treatments progress to stabilize and potentially correct the setting events leading to the bifascicular block.
In clinical use. The term trifascicular block is applied very sloppily. It should always be specified in more detail.
With trifascicular block, in general, all three main pathways into the ventricles are affected by being closed completely, incompletely, or intermittently. If there is a functioning heart rate, there is always one pathway that is not completely blocked. While occlusion of all three pathways marks the presence of trifascicular block, some ventricular beats still occur. In its fullest form, this amount of blockage is also referred to as AV block III (complete AV block). In it, the atria and ventricles have no direct electrical connection.
The most common (so named) variant of trifascicular block is a bifascicular block with AV Block I. This is not a trifascicular block; it is a bifascicular block with an AV block I component. Just be aware, although chronically mislabeled, it is an arrhythmia of importance as it can degenerate into complete heart block in a catastrophic manner and warrants aggressive handling (Sauer, 2025).
Other variants of trifascicular block:
Alternating BBB (right/left)
Alternating bifascicular block
Right BBB + AV block II - Mobitz II
Left BBB + AV block II - Mobitz II
Bifascicular block + AV block I
Left BBB + AV block I
Bifascicular block + AV block II - Mobitz I
Complete Trifascicular Block
“Complete” Trifascicular Block
Image 31: Complete Heart Block
AV dissociation.
Atria (P waves) and ventricles (QRS complexes) are independent.
Atria have their own frequency, and ventricles have their own frequency.
Ventricular escape rhythm has an ectopic focus in the area of the left posterior fascicle.
Third-degree AV block with bifascicular block pattern.
Sometimes referred to as a complete trifascicular block.
Full, complete heart block is not a trifascicular block. In a trifascicular block, at least some initiation of the ventricular contraction is occurring. We will take a closer look at complete heart block under its technical name, third-degree AV Block.
Complete Heart Block
Image 32: Complete Heart Block, Lead II and Lead I
Junctional rhythms are impulses that originate from the AV node, also referred to as the junction (Hafeez et al., 2025). These rhythms occur when the SA node, which is typically the heart's primary pacemaker, does not function effectively. For classification purposes, rapid junctional rhythms are often grouped with SVTs. This section examines impulses that begin at the junction.
If necessary, the AV node can function as an alternative pacemaker when the SA node fails, with an inherent rate of 40–60 bpm, which is slower than the SA node. In some cases, the AV node may increase its rate above that of the SA node, resulting in junctional tachycardia, where the heart rhythm is governed by the fastest depolarization cycle.
Junctional Tachycardia
Image 33: Junctional Tachycardia, 12-Lead
Heart Rate
Rhythm
P Wave
PR Interval
QRS
> 200
Regular
P may be immediately before, follow, or be buried in QRS. May be inverted or retrograde.
Short
Narrow < 0.12
Note the P wave immediately before the Q as seen on lead II. This P-wave presentation is common for all junctional rhythms, as the depolarization pacing point originates within the AV node. The depolarization wave must travel upwards into the atria simultaneously, or at least concurrently, as the aberrant firing wave heads to the bundle of His and ventricles (Scanlon, 2025a).
This is a fast rhythm originating in the AV junction before passing upwards into the atrium (retrograde P wave), then down into the ventricles (narrow QRS) (Tchou et al., 2023).
Junctional Tachycardia
Image 34: Junctional Tachycardia, Lead II
Be aware that P waves can occur before, during, or after the QRS complex.
This stimulus circulates in the AV Junction, triggering the ventricles and then retroactively firing the atria, QRS, and then the P wave. This is a re-entry arrhythmia (Heaton & Goyal, 2023).
AV Nodal Reentry Tachycardia
Image 35: AV Nodal Reentry Tachycardia, Lead II
See the P wave just after the S wave? In AVNT, it can hide inside the skirt tail of the S, so use those 12-lead EKGs/ECGs. By changing your angle of perception, P will have nowhere to hide.
Junctional escape rhythms are a sequence of electrical depolarizations that originate at, or near, the level of the AV node in the absence of a quicker, atrial, electrical depolarization event (Heaton & Goyal, 2023).
Before moving on from the discussion of atrial anatomy, it is important to address several rapid atrial arrhythmias—specifically, the atrial tachycardias. These arrhythmias are frequently distinguished from other SVTs due to their characteristic irregular rates and rhythms. Nonetheless, they are classified as SVTs, despite some debate within the cardiology community regarding this categorization. The primary examples of these fast and irregular SVTs include atrial fibrillation (AFib), atrial flutter, and multifocal atrial tachycardia.
Atrial Tachycardia
Image 36: Atrial Tachycardia, Lead II
Stimuli originate from one point in the atria that is not the SA Node.
The name says it all. Multifocal, yes. There must be at least three different P-wave morphologies to qualify. Each differing P reflects an alternate or aberrant depolarization origin within the atrium. Atrial, yes. The depolarizations are initiated from within the heart atria. Whether from areas of inflammation, irritation, scarring, or from medication or chemical toxicities. Tachycardia, yes. Faster than 100 bpm. The speed may be driven by increased cardiac demand, as in chronic obstructive pulmonary disease (COPD) and other pulmonary conditions (Lucchetti, 2024).
Multifocal Atrial Tachycardia
Image 37: Multifocal Atrial Tachycardia
Heart Rate
Rhythm
P Wave
PR Interval
QRS
QRS rate usually > 100
Irregular
More than three distinct P waves
Varies
Narrow < 0.12
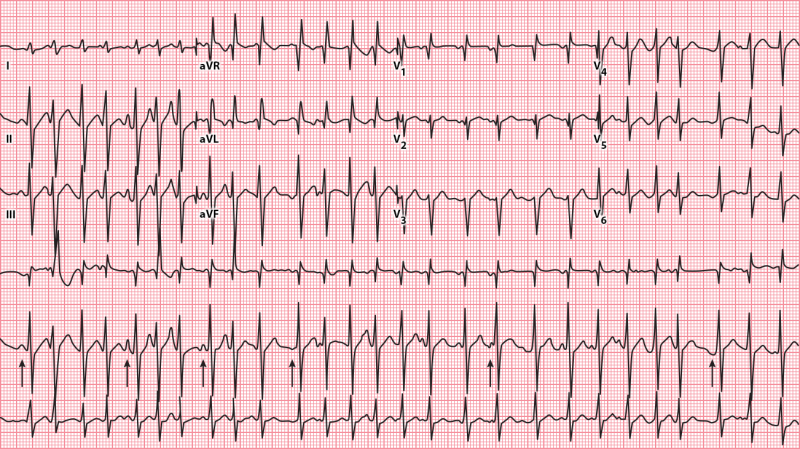
In lead II, arrows highlight different P wave morphologies, indicating irregular P-P intervals due to multiple electrical origins—not fibrillation or flutter. This tachycardia itself is not life-threatening, but its comorbidities often are. A rapid, irregular pulse may be the only sign, accompanied by symptoms such as shortness of breath, chest pain, palpitations, lightheadedness, or syncope.
Multifocal atrial arrhythmias can cause complications such as myocardial infarction, pulmonary emboli, and atrial thrombi, including stroke (Luchetti, 2024).
AFib is considered the most common type of treated cardiac arrhythmia, affecting 40 million people worldwide (Minneapolis Heart Institute Foundation, 2025).
Rhythmic atrial contraction contributes 20% to 30% of the heart's output (Scanlon, 2025b). Disruption of normal SA node function by irritation, inflammation, or other factors can lead to disorganized atrial depolarization, resulting in fibrillation or atrial quivering. AFib significantly compromises cardiac output, particularly in older adults or individuals with comorbidities, as effective atrial contractions are essential for optimal ventricular filling. Although many individuals with AFib remain asymptomatic, those who do experience symptoms may report sudden fatigue, dyspnea, dizziness, or chest pain, often remarking on the unexpected irregularity of their heartbeat.
Video licensed from
Complications of AFib can be serious (Johns Hopkins Medicine, n.d.).
Blood clots – Due to ineffective pumping, blood can churn and pool in the atria, allowing thrombi, emboli, or clots to travel through the blood to various parts of the body.
Stroke – Should an embolus reach the brain, a blood flow blockage or stroke may occur.
Cognitive impairment or dementias – Studies support that AFib is associated with increased rates of cognitive impairment, Alzheimer’s, and vascular dementia.
Heart attack – Women and African Americans show a considerable risk of heart attack associated with AFib.
Heart failure – The fast and uneven beating of the heart raises the risk of heart failure.
Sudden cardiac death – Sudden stoppage of cardiac function and AFib sadly walk hand in hand.
So please, do not think of AFib as just a quivering nuisance.
Atrial Fibrillation
Image 38: Atrial Fibrillation, 12-Lead
Heart Rate
Rhythm
P Wave
PR Interval
QRS
Atrial rate usually > 400
Irregular
No identifiable P waves
None
Narrow < 0.12
The QRS rate of AFib will be all over the scale. Fast, then slower, then well, chaotic. It is so unpredictable that there are, in some viewpoints, distinct types of atrial fibrillation (McDermott, 2025).
Runs of fibrillation, when they occur, tend to last longer than one week or until delivery of a small electric cardioversion shock or medication, resetting the heart back to a normal sinus rhythm, are referred to as persistent AFib.
In hemodynamically unstable patients, emergent electrical cardioversion to restore normal sinus rhythm is indicated. For stable patients, a careful evaluation of whether to pursue rhythm control or rate control should be conducted. Pharmacological interventions should be tailored to the individual patient's needs, and certain surgical options may also be considered. Additionally, anticoagulation therapy should be anticipated to reduce the risk of thromboembolic events.
Case Study
Maria is very busy. She runs a daycare center just off Broadway that has waiting lists of those wanting her services. When she walks into your office right at closing time with shoulders slumped and a haggard expression, you make time for her.
Reviewing her records during vitals check reveals hypertension, moderately high cholesterol, and occasional PACs, but nothing severe.
Your aide reports her current state – hypotensive, rapid, irregular pulse. You order an EKG/ECG and chat with Maria while it is being conducted. She mentions fatigue for over a week, heart beating rapidly and irregularly, and general malaise.
Image 40: Maria’s EKG/ECG
Now it is your turn. What is Maria packing that matches her symptoms?
I believe you will get:
A lack of P waves.
A rhythm that is irregular without any discernible pattern.
A squiggly "fibrillatory" baseline. NOTE: A wavy baseline will not be seen in all leads in all patients, so it is best to use the first two findings as strong diagnostic criteria.
Rapid ventricular response.
Course of action – You inform Maria that it was commendable for her to come in for evaluation. Part of her heart beats irregularly, while another part races to keep up. This is called AFib with a rapid ventricular response. Due to unwanted happenings such as blood clots, strokes, and such, your plan for her is:
A ride in a paramedic aide car while on a heart monitor to an emergency room, where a cardiologist can take a close look at that wayward heart. You will probably get a mild electrical shock to restore your heart rhythm, and you may go home later today.
Atrial flutter is the quintessential atrial tachyarrhythmia. Not the most common, yet it is the one a clinician tends to point out to students and state, “Now this is an atrial arrhythmia!”
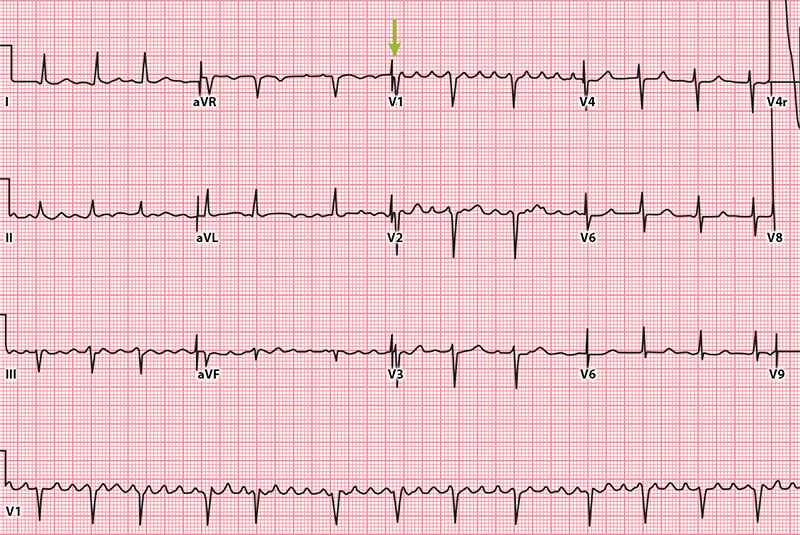
Flutter impulses traverse in the right atrium in a circular pattern. Each rotation creates a waveform on the EKG/ECG baseline—the distinctive saw-tooth pattern of the atrial flutter waves. While characteristically there are multiple P waves successfully constricting the atria, they only penetrate to the ventricular myocardium every second, third, or more atrial depolarizations. Pay special attention to leads II, III, aVF, and V1 to pick out the distinctive atrial flutter waves. Atrial rates typically range from 250 to 320 bpm. While ventricular rates typically range from 120 to 160 bpm, the most common ventricular rate in atrial flutter is 150 bpm, due to a phenomenon known as 2:1 AV block, which we will cover later.
Atrial Flutter
Image 41: Atrial Flutter, 12-Lead
Heart Rate
Rhythm
P Wave
PR Interval
QRS
The atrial rate is usually 250-320, and the ventricular rate 120-160
Regular
Sawtooth P waves
Varies
Narrow < 0.12
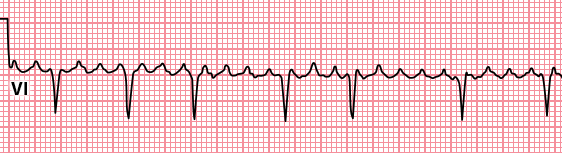
Here is a blowup of V1 from above. Note the choppy ocean waves of P in relation to the QRS complex. Most are 3:1, three P waves to each QRS. However, there is a variable ratio of P:QRS as we examine more of this lead. We would therefore call this atrial flutter with variable conduction (Prutkin, 2024).
Image 42: Atrial Flutter with Variable Conduction, V1
Atrial flutter is frequently associated with AV block, which refers to impaired conduction of electrical impulses from the atria to the ventricles. AV blocks can manifest as delayed depolarization and, in certain instances, may result in a total cessation of conduction. Etiologies range from benign factors, such as increased vagal tone during sleep, physical activity, pain, or carotid sinus stimulation, to pathological conditions including cardiac fibrosis, sclerosis, ischemic heart disease, alterations in myocardial tissue, certain medications, and hyperkalemia (Sauer, 2024).
AV block is classified according to the severity of the conduction disturbance, which is divided into three degrees: first-degree AV block; second-degree AV block, which includes type I (Wenckebach or Mobitz I) and type II (Mobitz II); and third-degree (complete) AV block (Sauer, 2024).
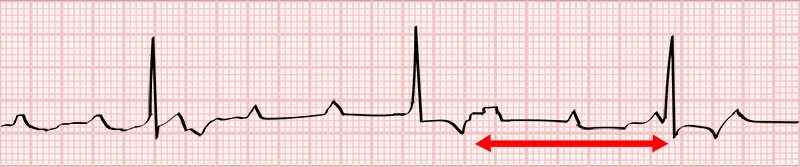
Regular PR intervals greater than 200 ms with no interruption in atrial to ventricular conduction are the signature indication of a first-degree AV block. All the waves will be present. A slightly broader PR than in a normal sinus rhythm will be all that characterizes first-degree AV Blocks.
First-Degree AV Block
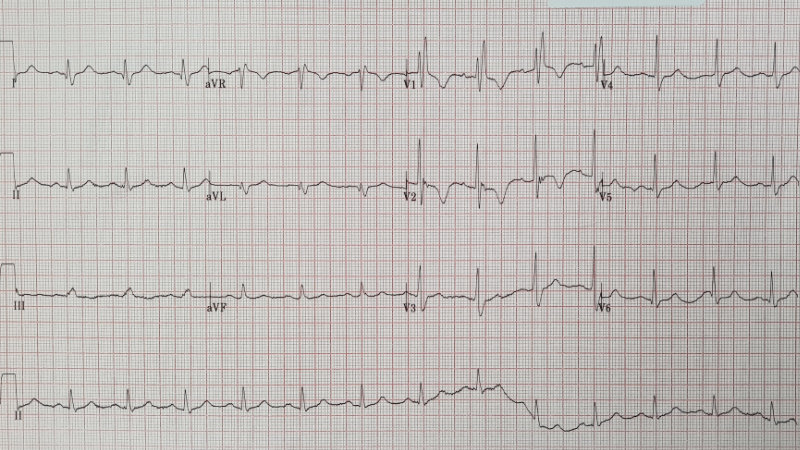
Image 43: First-Degree AV Block, 12-Lead
Heart Rate
Rhythm
P Wave
PR Interval
QRS
60-100
Regular
Regular
> 0.20 ms
Narrow < 0.12
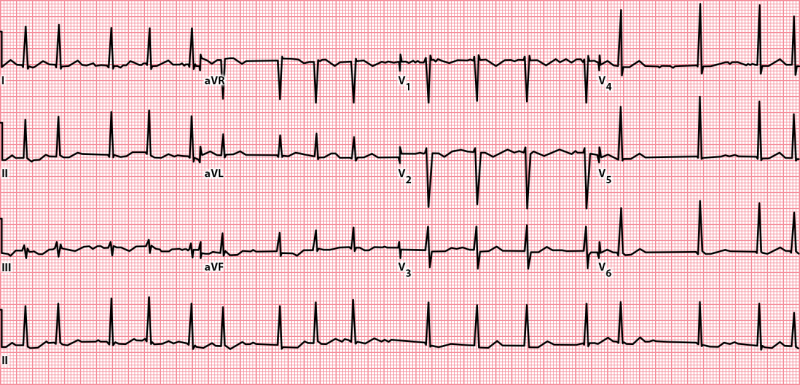
First-degree AV block is characterized by a heart rate that typically aligns with normal sinus rhythm (60-100 bpm) but exhibits a prolonged PR interval. Notably, this condition does not involve missed beats, as QRS complexes are present after every P wave. In highly trained athletes or healthy young individuals with elevated vagal tone, first-degree AV block may be benign and detected incidentally. For others, additional evaluation is advisable to assess potential underlying cardiac pathology or, more commonly, effects related to pharmacological agents (Sauer, 2024).
Instead of staying static, the PR interval progressively lengthens in a second-degree Mobitz type I AV block. This sequential lengthening until a QRS complex is dropped and the AV node conduction is picked back up with the next beat is often referred to as the Wenckebach phenomenon, described by Karel Frederik Wenckebach, a color-blind zoologist in his second career as an outstanding physician, in 1899 (Cadogan, 2025).
Second-Degree AV Block Mobitz Type I
Image 44: Second-Degree AV Block Type I, 12-Lead
Heart Rate
Rhythm
P Wave
PR Interval
QRS
Dropped QRS may lead to a slow heart rate
Mostly Regular
Regular
Gradual lengthening of PR until QRS dropped
Normal
Second-degree AV block, Mobitz type I, is typically regarded as a benign arrhythmia. The risk of progression to complete heart block is low. If hemodynamic problems occur, implantation of a cardiac pacemaker is recommended as a treatment option.
Let us take a closer look at the strip above in lead II.
Image 45: Second-Degree AV Block Type I, Lead II
P waves are regular, with receding QRS complexes until a QRS drops, then the pattern repeats.
Mobitz type II second-degree AV block involves the His-Purkinje system, often termed the distal conduction system. When conduction is interrupted at the level of the His bundle or slightly below within the Purkinje branches, normal impulse transmission ceases. In Mobitz type II block, P waves occur at regular intervals, and the PR interval remains constant. When QRS complexes are intermittently absent, the uninterrupted sequence of P waves persists on the baseline, with QRS complexes resuming the same PR interval as previously observed.
This distinctive pattern—regular P waves with periodic absence of QRS complexes—defines P-to-QRS conduction blocks, denoted as P:QRS. For instance, a 3:2 block features three P waves corresponding to two conducted QRS complexes before a QRS complex is omitted. While the P:QRS ratio may vary between patients (e.g., 2:1, 3:1, 4:1), it typically remains consistent for any individual patient.
Mobitz type II blocks carry a significant risk of progression to complete heart block, which may result in ventricular escape rhythms that are insufficient to sustain adequate perfusion or may precipitate sudden cardiac death. Diagnostic evaluation should include continuous ambulatory electrocardiographic monitoring, such as a twenty-four-hour Holter monitor. The recommended management for Mobitz type II AV block is the implantation of a permanent cardiac pacemaker (Sauer, 2024).
Complete heart block, also known as third-degree AV block, is characterized by a total absence of conduction impulses reaching the ventricles. This condition results in AV dissociation, with no functional association between the P waves and QRS complexes.
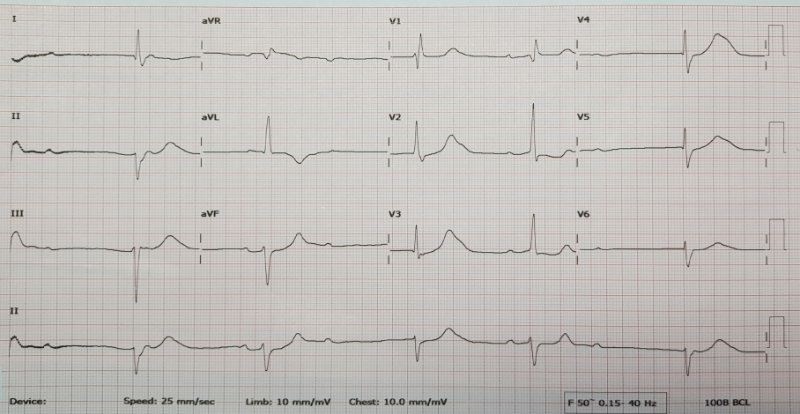
Third-Degree AV Block
Image 47: Third-Degree AV Block, Lead II
Heart Rate
Rhythm
P Wave
PR Interval
QRS
Different atrial and ventricular rates
Regular ventricular
Disassociated from QRS
No relationship
Widens the lower the escape source
In third-degree block, the rate of P waves is typically higher than the QRS ventricular firing rate due to the intrinsic escape rates of the atria and ventricles. Escape pacing below the atria that originates above the His bundle bifurcation, such as a junctional escape rhythm, results in narrow QRS complexes and a heart rate greater than 40 bpm. When escape pacing arises below the bifurcation, such as with a ventricular escape rhythm, wide QRS complexes, and a lower heart rate are observed, which may be associated with symptoms like syncope, low blood pressure, and heart failure (Sauer, 2024).
Third-Degree AV Block
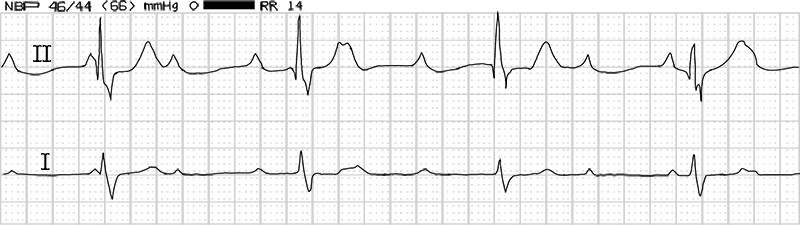
Image 48: Third-Degree AV Block
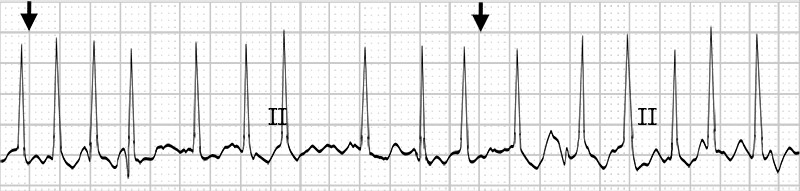
Notice in this monitor strip that the atrial rate is fast, at 104 bpm, and regular. The ventricular rate is regular but slow, 47 bpm. Neither atrial nor ventricular rates relate to the other. This EKG/ECG is distinctive of third-degree AV block, complete dissociative heart block.
Most patients experiencing complete heart block will require an implanted cardiac pacemaker, as their heart system is no longer able to supply this function adequately.
No talk on heart arrhythmia would be complete unless it meandered into this, the Where’s Waldo of heart arrhythmias—the wandering pacemaker.
A wandering atrial pacemaker is an arrhythmia originating in the atria where the pacing sources shift between the SA node, odd source spots within the atria themselves, and the AV node. These shifting, skipping-about, stimulus sites are best seen from lead II by looking for morphologic changes in the P waveform (Mond, 2024). It is most often seen in the young, the aging, or in fit athletes. It tends not to be symptomatic and rarely requires treatment, though the presence of the medication digoxin, or sometimes COPD, has been associated with it. A wandering atrial pacemaker is a favorite rhythm for instructors to use when teaching interns or learners, often saying, “What is wrong here?”
Wandering Atrial Pacemaker
Image 49: Wandering Atrial Pacemaker, Lead II
Heart Rate
Rhythm
P Wave
PR Interval
QRS
60-100
May or may not be Regular
From at least three sources
Mostly Regular
Narrow
At least three diverse sources of atrial stimulation must be present. By sources, we mean three distinct pacing morphologies. So, yes, two different P sources might originate from the SA node yet follow different conduction paths, thus creating P waveforms that are distinct from each other. The QRS, however, should be consistent and narrow. If the cardiac strip above were faster, the arrhythmia would be considered multifocal atrial tachycardia.
Wandering Atrial Pacemaker
Image 50: Wandering Atrial Pacemaker, 12-Lead
Using the various leads, track the P waves.
To fully fit the diagnosis of wandering atrial pacemaker, we need three (or more) distinct P wave sources (morphologies).
WPW displays intervals of abnormally fast heartbeats intruding on what otherwise would be a normally functioning heart rate. This rate is due to an additional abnormal electrical conduction pathway in the heart, which occasionally activates, leading to an extremely fast SVT. The accessory pathways or bypass tracts connect the atrium to the ipsilateral (on the same side) ventricle, allowing the ventricles a depolarization charge that pre-excites them, urging them to fire fast and often. Hence, the delta wave is a significant clue that a secondary, faster pathway is present that should not be there at all.
This accessory pathway phenomenon, sometimes referred to as the Kent pathway, is shown by a short PR interval. By bypassing the AV node, the PR interval shortens. A delta wave becomes visible and represents early activation of the ventricles from the bypass tract. A form of fusion QRS results from two activation sequences, one from the bypass tract and one from the AV node. ST-T changes occur secondary to changes in the ventricular activation sequence (Hacking, 2025).
Image 51: Delta Wave, Lead II
Video licensed from
Short PR intervals and delta waves are best seen in leads V1-5. Pseudo-Q waves, seen in leads II, III, and aVF, are not Q waves but rather are negative delta waves. So do not be confused by the false Qs. There is no inferior myocardial infarction on this EKG/ECG.
For a diagnosis, WPW must be seen in more than one lead.
Wolff-Parkinson-White
Image 52: Wolff-Parkinson-White Syndrome
Heart Rate
Rhythm
P Wave
PR Interval
QRS
60-100 or more
Regular
Slurs into Q
Short when using the accessory pathway
> 0.10
Rate: Usually 60-100 beats/min, but may be either faster or slower. WPW may be due to congenital pathways that allow rapid conduction of impulses. These pathways predispose the patient to atrial tachycardia since there is no blocking of impulses at the AV node.
PRI: If this interval is short, the sinus impulse partially avoids its normal delay in the AV node by traveling rapidly down the accessory pathway.
QRS: Often greater than 0.10 seconds since there is no delay in the AV node. Subsequent activation of the ventricles depends upon the intra-atrial conduction time from the sinus node to the accessory pathway, plus conduction time down the accessory pathway, compared with sinus node conduction time to the ventricles via conduction pathways.
Delta wave: Slurring occurs at the beginning of the QRS complex due to an aberrant entry pathway.
Secondary T-wave changes: Because ventricular depolarization is abnormal, repolarization will also be abnormal, resulting in ST and T-wave changes that are secondary to the degree and area of pre-excitation.
Abnormal Q waves: Q waves are considered abnormal when they have an amplitude of 25% of the succeeding R wave or a duration of 0.04 seconds or greater. Such Q waves are often seen in the presence of an accessory AV pathway and may be misdiagnosed as a myocardial infarction. These are negative delta waves, not Q waves, and they reflect pre-excitation and not myocardial necrosis (Hacking, 2025).
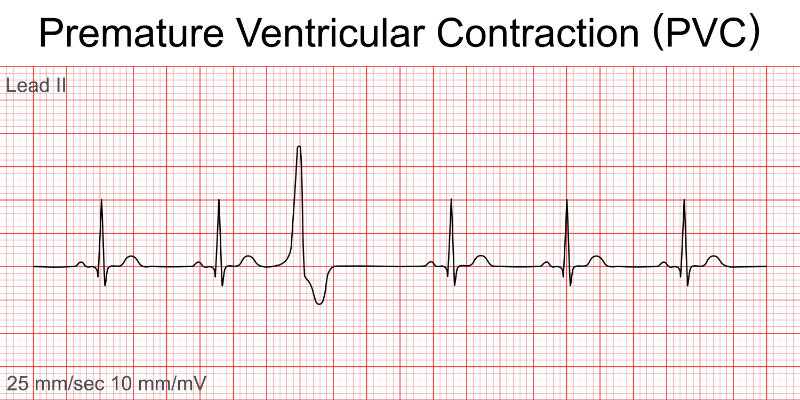
Ventricular impulses come from the ventricles. The large muscular chambers of the lower heart push a pulsing stream of blood out into the body. When a command to contract signals fails to arrive from the primary pacemaker, the sinus node, escape cells within the ventricles step up to emit electrical depolarization waves that contract the ventricular myocardium.
Any early, untimely cardiac contraction arising from the ventricles is a PVC. Many, if not most, people who have the occasional PVC are completely unaware of them. Those who do perceive them tend to describe the sensation as a skipped beat or pounding heart. Both are accurate descriptions of what is brought about by the hemodynamic changes of sudden, early ventricular contractions (Sattar & Hashmi, 2025).
Premature Ventricular Complexes
Image 53: Premature Ventricular Complexes, Lead II
Heart Rate
Rhythm
P Wave
PR Interval
QRS
60-100
Regular atrial
Disassociated from the abnormal QRS
None on Abnormal QRS
Wide on abnormal beat > 0.12
Rate: Atrial and ventricular rate dependent upon the underlying rhythm.
Rhythm: Irregular due to PVC. If PVC is sandwiched between two normal beats, it is called interpolated, and the overall rhythm will be regular.
P waves: A P wave is not associated with the PVC.
PR interval: None with the PVC because the ectopic beat originates in the ventricles.
QRS: > 0.12 wide and bizarre. The T wave frequently occurs in the opposite direction of the QRS complex. If the QRS is negative, the T wave is usually upright; if the QRS is positive, the T wave is usually inverted (Sattar & Hashmi, 2025).
Premature Ventricular Contraction
Image 54: PVCs, Lead II
Interpolated PVC.
No P associated with QRS.
The pause that refreshes is abnormally prolonged.
Video licensed from
PVCs may be due to stress, activity, valvular disease, coronary artery disease, heart attack, caffeine, antihistamines, or decongestants. The PVC may produce a weak pulse, and it is the patient who should be treated, not the monitor.
PVCs coming fast upon the QRS complex directly before, especially during the T wave myocardial recovery cycle, are a red alert for triggering a ventricular depolarization loop leading into VT or straight into VF.
Image 59: R-on-T Beats, Lead II and V1
When evaluating abnormal or aberrant ventricular beats, it is important to consider both the origin of the source and the rate. Ventricular contractions typically display wide QRS complexes greater than 0.12 seconds and lack PR interval consistency. Regarding rate, in the absence of contributing comorbid conditions or causative factors, a ventricular escape rhythm usually ranges from 20 to 40 bpm.
Idioventricular rhythm is also known as a ventricular escape rhythm (Burns & Buttner, 2024b).
Three or more ventricular origin beats in a row constitute an idioventricular rhythm. Typically, it is transient, with a brisk return to a heartbeat of atrial derivation. Syncope, dizziness, and other symptoms accompany the rapid hemodynamic slowing that occurs with this rhythm.
Rate: Intrinsic rate is 20-40 bpm.
Rhythm: Atrial not discernible, ventricular regular.
P waves: Absent.
PR interval: None.
QRS: > 0.12
It may be due to a heart attack, metabolic imbalances, or severe hypoxia. Treatment includes activation of the emergency code and cardiopulmonary resuscitation (CPR) if a patient is pulseless. Lidocaine is contraindicated since it may knock out the last available pacemaker.
Accelerated idioventricular rhythm occurs at a rate faster than a ventricular escape rhythm but slower than the threshold for VT. It may be present as a benign or asymptomatic arrhythmia, though symptoms are not always present. It is most frequently observed during cardiac tissue recovery following myocardial injury, a period when additional cardiac stress can influence the recovery process. Accelerated idioventricular rhythm may be due to heart disease (e.g., acute myocardial infarction, digitalis toxicity, reperfusion of a previously occluded coronary artery), may occur during resuscitation, drugs (e.g., digoxin), dilated cardiomyopathy, and during outpatient procedures (especially during spinal anesthesia).
Rate: Atrial not discernible, ventricular 40-100 bpm.
Rhythm: Ventricular rate regular, an atrial rate not discernible.
VT is a regular fast heart rate originating from an area of ventricular irritation. Short bursts of rapid ventricular contractions may not endanger a person. However, the less efficient circulation of blood from prolonged bouts can be life-endangering.
Characteristic findings indicating VT are tachycardia at > 100 bpm, wide QRS complexes > 0.12, and AV dissociation. VT can be monomorphic, originating from one electrical excitation, where all QRS complexes look alike, or polymorphic, where multiple spots of electric stimulation are firing within the ventricles. Polymorphic VT is seen when each QRS shows a different morphology.
Bursts of VT lasting under 30 seconds are referred to as non-sustained, while stretches longer than 30 seconds are referred to as sustained.
Symptoms of VT fall along the lines of reduced cardiac output and include hypotension, dizziness, syncope, cardiogenic shock, and cardiac arrest (Foth et al., 2023).
Ventricular Tachycardia
Image 61: Ventricular Tachycardia, 12-Lead
Heart Rate
Rhythm
P Wave
PR Interval
QRS
100-250
Regular
Absent or not related to rhythm
NA
> 0.12
Rate: Ventricular rate 100-250 bpm; atrial rate tends not to be discernible.
Rhythm: Atrial is not discernible, ventricular is regular.
P waves: May or may not be present. If present, they have no set relationship with the QRS complexes. P waves may appear between the QRS complexes at a rate different from that of the VT.
PR interval: None.
QRS complex: Wide, > 0.12 (or three small EKG/ECG squares). It is often difficult to differentiate between the QRS complex and the T wave. Three or more PVCs in a row at a rate of 100 per minute are referred to as a "run" of VT. There may be a long or a short run. A patient may or may not have a pulse. If it is unclear whether a regular, wide QRS tachycardia is VT or SVT, treat the rhythm as VT until proven otherwise.
Note: VT can occur in the absence of apparent heart disease.
T wave: Difficult to separate from QRS.
QT interval: Should be 390-450 ms. If longer, be on alert for torsades de pointes.
Other components: The presence of three or more consecutive wide QRS complexes at a rate equal to or greater than 100 per minute, accompanied by evidence of AV dissociation, confirms the diagnosis of VT. If the rapid QRS complexes are morphologically like those observed during the patient's normal sinus rhythm, an SVT should be considered (Foth et al., 2023).
VT may arise as an early or late complication of myocardial infarction, or in association with cardiomyopathy, valvular heart disease, myocarditis, electrolyte disturbances, or post-cardiac surgical procedures.
Torsades de pointes or “Twisting of the Points” is a type of polymorphic VT signified by a prolonged QT interval. The characteristic that makes it distinctive is how the QRS complexes twist around the isoelectric baseline during self-limiting bursts.
According to a recent edition of the U.S. Pharmacist, more than 200 medications prescribed on the global market may cause prolonged QT intervals with runs of torsades de pointes (U.S. Pharmacist, 2024). These include antiarrhythmic drugs, antibiotics, antidepressants, antipsychotic agents, and others.
R-on-T Phenomenon
Image 62: R-on-T, Lead II
Regular beat with extended recovery time, PVC, regular beat with extended recovery time, and there – aberrant PVC firing on the prolonged T wave of the beat before (easier to spot on a 12-lead), triggering a run of VT.
Let us see that drawn out for a clearer perspective.
T-Wave Period of Vulnerability
Image 63: T-Wave Maximum Vulnerability
Remember, the T wave represents the time of ventricular repolarization. While this resting refractory period occurs, the cardiac ventricles are at their most vulnerable part of their action potential.
Alternatively, in cardiology speaking, this is the most arrhythmogenic part of the ventricular action potential cycle.
It only lasts 0.01 seconds, so yes, it is hard to hit; however, torsades de pointes is real and does occur. On the EKG/ECG, that narrow window of vulnerability occurs just before the peak of the T wave.
The R-on-T phenomenon occurs when a PVC lands on the T wave of the preceding heartbeat, which can lead to dangerous heart rhythms like VT or fibrillation. This timing is critical because it can disrupt the heart's normal electrical activity, potentially resulting in serious complications.
The R-on-T phenomenon plays a significant role in torsades de pointes due to the prolonged QT interval that is associated with it. For example, as a PVC stomps on the tail of an extended T wave, torsades de pointes or polymorphic VT may be triggered. This occurrence magnifies the need for a thorough review of patient medications, as drug-induced long QT syndrome is, unfortunately, common.
Torsades de Pointes
Image 64: Torsades de Pointes, Lead II
Heart Rate
Rhythm
P Wave
PR Interval
QRS
>150
Irregular
Absent or not related to rhythm
NA
> 0.12
Rate: > 150 bpm.
Rhythm: Irregular with an oscillating or spindle-like twist around the baseline.
P waves: Absent, yet if by chance you see some, they will not be related to the QRS complexes.
PR interval: Chaotic
QRS complex: Each differs from its neighbor. There will be an overall effect of tall QRSs, which shorten then regain height. This complex goes with the spindle or torsade’s effect.
T wave: In the QRS complexes just before the torsade’s effect triggers, look for long, prominent T waves. Also, keep an eye out for the R-on-T phenomenon, which can trigger VT or VF.
QT interval: Prolonged QT intervals may be congenital or, more commonly, an unwanted effect of some prescription and over-the-counter medications.
Other components: Torsades de pointes is a significant adverse arrhythmia. However, the great concern when present increases in rate and degenerates into an even deadlier arrhythmia, VF.
May be provoked by: R-on-T trigger, antiarrhythmics, antipsychotics, antiemetics, antifungals, antimicrobials, any pharmaceutical with the adverse effect of prolonging the cardiac QT interval. Also, be aware of substances that slow down hepatic metabolism. Slower liver breakdown of complex chemicals can turn a previously tolerated QT-prolonging substance into a landmine trigger, just waiting for an early R wave to activate the torsade’s effect.
VF is regarded as the most important shockable arrhythmia during cardiac arrest (Burns & Buttner, 2024c). This is where the lower heart chambers quiver rather than constrict. Too many electrical polarization signals, arriving much too rapidly, reduce the strong rhythmic myocardial contractions to chaotic spasms. VF is a lethal arrhythmia resulting in rapid loss of consciousness, no pulse, and cardiac death in the absence of treatment.
VF is considered a medical emergency. Despite high-quality medical intervention, approximately 50% of individuals experiencing VF will not survive due to cardiac arrest or its complications (Fogoros, 2026). In the absence of prompt treatment, clinical death typically occurs within minutes when VF is present as the predominant rhythm. Even in cases where resuscitation is successful, patients may suffer from hypoxic brain injury and other neurological impairments, necessitating ongoing monitoring and potentially long-term care.
VF is often associated with structural damage to the heart. Factors that can irritate or inflame the Purkinje cells of the ventricles may contribute to the onset of multiple rapid stimuli, leading to VF. Myocardial infarction, for instance, is linked to a higher incidence of VF during the acute phase of myocardial injury (Scanlon, 2025c). Most occurrences of VF after myocardial infarction take place early when tissue ischemia is most severe.
Various conditions have been identified in association with VF, including electrolyte imbalances (such as hypokalemia, hyperkalemia, and hypomagnesemia), acidosis, hypothermia, hypoxia, cardiomyopathies, a family history of sudden cardiac death, congenital QT abnormalities, and alcohol use.
Image 65: Ventricular Fibrillation, Lead II
Video licensed from
Rate: Rapid and disorganized.
Rhythm: Irregular and chaotic.
P waves: Absent, but may be recognized among the chaos.
PR interval: Not measurable.
QRS complex: Composed of fibrillatory waves, wide, irregular oscillations of the baseline.
T wave: Not measurable.
QT interval: Not measurable.
Other components: Coarse VF is where most waveforms are three mm or wider. Fine VF is where most waveforms are less than three mm.
Asystole or flatline is synonymous with ventricular standstill and death. Asystole is usually associated with prolonged circulatory insufficiency and cardiogenic shock. It could also be drug-related, hypothermia-related, and at times reversible.
Asystole is the disappearance of all ventricular electrical activity, meaning the absence of all physiological pumping actions. Be aware that this means there may still be atrial activity. Atrial activity in the presence of ventricular standstill, e.g., P-wave asystole, may respond to electrical pacing (Krivenko, 2018).
Fading to Asystole
Image 66: Fading to Asystole
When asystole occurs, oxygenated blood flow to all organs stops almost immediately. The brain is highly dependent on a constant supply of oxygen, making it especially sensitive to deprivation. Irreversible damage to brain cells may begin within four to six minutes without oxygen.
On an EKG/ECG monitor, this is represented by a straight, flat or slightly undulating line, indicating the absence of the standard waveforms associated with heartbeats. This condition is distinct from other types of cardiac arrest, such as VF or pulseless VT, where electrical activity remains and may respond to defibrillation.
When blood flow feeding a part of the heart becomes blocked, myocardial tissue becomes distressed due to ischemia, the lack of metabolic oxygen. Should this condition persist, necrosis or tissue death occurs. EKG/ECG readings are one of the quickest ways to diagnose myocardial infarction. When ancillary symptoms arise (e.g., chest or shoulder pain, shortness of breath, arm or jaw pain, dizziness, heart rhythm disturbances), seek help and initiate active EKG/ECG monitoring as soon as possible (Reeder & Kennedy, 2025).
EKGs/ECGs show the presence of heart ischemia. Two main types of myocardial infarction stand out clearly with EKG/ECG monitoring: the ST-elevation myocardial infarction (STEMI) and the non-ST-elevation myocardial infarction (NSTEMI).
STEMI is the presence of ST elevation on the EKG/ECG with ischemia. Appearance of a new left BBB also counts.
ST Elevation in STEMI
Image 68: STEMI vs NSTEMI
Measure ST elevation at the J-point (Reeder & Kennedy, 2025).
Depending on where the most significant changes are observed, the location of the ischemic injury may be approximated.
STEMI Locations
Image 69: STEMI Locations 12-Lead Changes
So, where is that STEMI?
Look for the lead demonstrating the MOST change. That is your clue map to injury.
EKG/ECG signs can help determine the age of a STEMI.
Hyperacute phase - seconds to minutes.
Initially, in STEMI, elevation of the J-point in two contiguous (covering shared or neighboring areas) EKG/ECG leads, and the appearance of elevation in the ST segment, represent local hyperkalemia from cellular trauma.
Acute phase – minutes to hours.
The ST retains its concave curve during the first of the EKG/ECG changes. With time, the ST-segment elevation becomes more prominent, and the ST segment begins to curve or become more rounded upward without a Q wave.
Post-acute – hours to a few days.
Tellingly, the ST segment may eventually become indistinguishable from the T wave; the QRST complex can resemble a monophasic action potential form. ST elevations with Q waves.
Very old – weeks to months.
Around two weeks post-event, the ST elevation begins to subside, returning close to the isoelectric baseline. R-wave changes also decrease, and the Q wave deepens without ST elevations.
NSTEMI symptoms are indicative of an acute cardiac event, acute coronary syndrome (Rawshani, 2024). It may be myocardial ischemia from unstable angina or myocardial infarction. The elevation of troponin levels, even in the absence of ST elevations on the EKG/ECG, suggests the possibility of NSTEMI, or non-ST-elevated myocardial infarction.
NSTEMI demonstrates ST-depression, T wave inversions, with or without a transient ST-elevation in leads that face the area of injury. ST depression can be either upsloping, down-sloping, or horizontal.
Image 70: ST Depression Forms
Horizontal or down-sloping ST depression of 0.5 mm or greater at the J-point in two or more contiguous leads may indicate myocardial ischemia. ST depression of ≥ 1 mm is considered more specific and may be associated with a poorer prognosis. ST depression of ≥ 2 mm in three or more leads has been correlated with a higher probability of NSTEMI and an increased mortality risk. Upsloping ST depression is not specific for myocardial ischemia. The combination of widespread ST depressions and ST elevation in aVR > 1 mm can suggest left main coronary artery occlusion. ST depression in leads I, II, V4-6 is typically associated with widespread subendocardial ischemia.
Natural electrical sources produce heart rhythms within the cardiac tissues. When those natural pacemaker sites fail by producing too fast, too slow, or an absence of depolarization signals, another source of control is warranted. Enter the shock from beyond, the artificial cardiac pacemaker.
An implantable cardiac pacemaker is the most commonly used type (Oklahoma Heart Hospital, 2023). There are also external pacemakers that introduce a rhythmic electronic pulse into the heart tissue through the skin, which is used mostly during emergencies. Internal pacemakers can be temporary or permanent and are used in cases requiring long-term support to override a dangerous heart rhythm or replace an absent functional heart rhythm.
Image 71: Electronic Pacemaker Spikes, Lead II, V1
Implantable pacemakers can create shocks on demand or continuously. They tend to stimulate just one or two heart chambers. The small pacemaker unit is implanted under the skin with output leads, thin, coated wires connected directly to the heart muscle. Small batteries provide power to recognize the heart's electrical activity and provide needed electrical pulses to the heart muscle.
It can be used on patients with significant or complete heart blocks. The rate is preset to a constant rhythm and rate, such as 70 bpm, although rate changes can be made using external magnetic control (most commonly).
Demand pacemaker
Only fires when the R-R interval of the patient's natural rhythm meets or exceeds a preset limit.
R-Triggered Pacemaker
When dealing with heart blocks that allow the occasional sinus rhythm, the ventricular-synchronized demand-type pacemaker, also known as the R-wave-triggered pacer, looks for the absence of R waves and stimulates the heart ventricles should they not appear, after a short delay.
R-Blocked Pacemaker
For patients with a sinus rhythm and only occasional heart blocks, the R-wave blocked pacemaker stops firing when it detects a natural R wave produced by the patient.
Atrial Triggered Pacemaker
When detecting natural atrial depolarization, the pacemaker stimulates the ventricles after a reasonable delay. This pacemaker provides the optimal cardiac output while maintaining normal atrial rate fluctuations.
Image 72: Atrial Single Chamber Pacemaker Spikes, Lead II and V1
Dual Chamber Pacemaker
Treats most sino-atrial conditions by providing both atrial and ventricular stimulation whenever needed.
Firing refers to the pacemaker's generation of an electrical stimulus. This impulse is seen as a narrow vertical spike on the EKG/ECG.
Atrial Demand Pacemaker (Single Chamber)
Image 73: Atrial Demand Pacing, Lead II
No pacer spike before the first P, as it is on time.
Second P is late, so spike.
Third P is late, so spike.
Capture refers to the presence of a P, a QRS, or both after a pacemaker spike. This capture indicates that the tissue in the heart chamber being stimulated has been depolarized. The term is that the pacemaker has "captured" the chamber being paced. Paced QRSs are wide and bizarre, resembling the morphology of PVCs.
Image 74: Ventricular Single Chamber Pacemaker, Lead II and V1
Sensing refers to the pacemaker's ability to recognize the patient’s intrinsic rhythm to determine if it needs to fire. Most pacemakers function in the “demand” mode and fire when needed.
The human heart is an exceptionally complex and efficient organ, unmatched by any artificial pumping device. Myocardial muscle cells are responsible for circulating approximately six thousand liters of blood each day. The heart's electrical system, which governs these cellular functions, relies on rhythmic impulses generated by natural pacemaker cells at the apex of the heart. To ensure reliability, secondary pacemaker sites are in place to provide backup if primary pacing fails. Therefore, it is crucial to employ consistent methods to assess the heart's electrical activity and understand its function.
Electrocardiography involves recording and analyzing the electrical activity of the heart. An EKG/ECG is a rapid and straightforward cardiac testing procedure for patients: adhesive electrodes are applied to the skin, connected by wires, and the recording begins. This process allows health professionals to observe the heart’s electrical function. As the electrical conduction wave travels through the heart, it produces distinct waveforms on the isoelectric baseline of an EKG/ECG monitor strip.
Using a systematic approach, we can determine where the rhythm originates from the atria, junction, or ventricles, if it is normal, fast, or slow, if there are unusual beats, if the entire rhythm is unusual and perhaps an unwanted arrhythmia, and if unusual spots of excitement, electrical blockage, chaotic electrical fibrillation, or lack of electrical activity are present.
As we advance in skill, we can not only see and interpret natural cardiac functions, but we can also extrapolate what is happening on a cellular level and anticipate the likely course of action needed to offset ischemia or aberrancies. The potential of quickly targeted interventions is, and will continue to be, lifesaving.
When you want to see the heart of health issues, remember, EKG/ECG!
Select one of the following methods to complete this course.
Take TestPass an exam testing your knowledge of the course material.
CEUFast, Inc. is committed to furthering diversity, equity, and inclusion (DEI). While reflecting on this course content, CEUFast, Inc. would like you to consider your individual perspective and question your own biases. Remember, implicit bias is a form of bias that impacts our practice as healthcare professionals. Implicit bias occurs when we have automatic prejudices, judgments, and/or a general attitude towards a person or a group of people based on associated stereotypes we have formed over time. These automatic thoughts occur without our conscious knowledge and without our intentional desire to discriminate. The concern with implicit bias is that this can impact our actions and decisions with our workplace leadership, colleagues, and even our patients. While it is our universal goal to treat everyone equally, our implicit biases can influence our interactions, assessments, communication, prioritization, and decision-making concerning patients, which can ultimately adversely impact health outcomes. It is important to keep this in mind in order to intentionally work to self-identify our own risk areas where our implicit biases might influence our behaviors. Together, we can cease perpetuating stereotypes and remind each other to remain mindful to help avoid reacting according to biases that are contrary to our conscious beliefs and values.
ACLS Medical Training. (n.d.). The Basics of ECG. ACLS Medical Training. Visit Source.
Alvarado, C. (2025). SVT: Supraventricular Tachycardia. Cardiology Advisor. Visit Source.
Biology Insights. (2025). P Wave on ECG: Normal and Abnormal Morphology. Biology Insights. Visit Source.
Burns, E. & Buttner, R. (2024a). Q Wave. Life In The Fastlane. Visit Source.
Burns, E. & Buttner, R. (2024b). Ventricular Escape Rhythm. Life in the Fastlane. Visit Source.
Burns, E. & Buttner, R. (2024c). Ventricular Fibrillation (VF). Life in the FASTLANE. Visit Source.
Cadogan, M. (2025). Karel Wenckebach. Life in the FASTLANE. Visit Source.
Cadogan, M., & Buttner, R. (2022). Delta Wave. Life in the FASTLANE. Visit Source.
Cadogan, M., & Buttner, R. (2025). Osborn Wave (J Wave). Life In The Fastlane. Visit Source.
Cardiovascular Medicine. (n.d.). ECG interpretation: Characteristics of the normal ECG (P-wave, QRS complex, ST segment, T-wave). Cardiovascular Medicine. Visit Source.
Kashou, A. H., Basit, H., & Chhabra, L. (2022). Physiology, Sinoatrial Node. In StatPearls. StatPearls Publishing. Visit Source.
Kashou, A. H., Basit, H., & Malik, A. (2023). ST Segment. In StatPearls. StatPearls Publishing. Visit Source.
King, J., & Lowery, D. R. (2023). Physiology, Cardiac Output. In StatPearls. StatPearls Publishing. Visit Source.
Klabunde, R. (2023). Membrane Potentials. Cardiovascular Physiology Concepts. Visit Source.
Knight, B. P. (2025). Anatomy, pathophysiology, and localization of accessory pathways in the preexcitation syndrome. UpToDate. Visit Source.
Krivenko, A. (2018). Asystole. Healthy Life. Visit Source.
Lee, S. (2025). Mastering Einthoven’s Triangle in Biomedical Engineering. Number Analytics. Visit Source.
Lome, S. (n.d.a). Left Bundle Branch Block (LBBB) ECG Review. Healio. Visit Source.
Lome, S. (n.d.b). QT Interval. Healio. Visit Source.
Lucchetti, L. (2024). What to know about multifocal atrial arrhythmia. Medical News Today. Visit Source.
MacKinnon, L. & Haque, O. (2025). Internal Balance of Potassium. TeachMe Physiology. Visit Source.
McDermott, A. (2025). Types of Atrial Fibrillation: What You Need to Know. Healthline. Visit Source.
McKenna, W. (2024). Arrhythmogenic right ventricular cardiomyopathy: Anatomy, histology, and clinical manifestations. UpToDate. Visit Source.
Miller, V. (2023). Sinus pause and arrest. Cardiology Today, 13(2): 76-78. Visit Source.
Minneapolis Heart Institute Foundation. (2025). Understanding Atrial Fibrillation: Symptoms, Risks, and New Hope for Treatment. Minneapolis Heart Institute Foundation. Visit Source.
Mond, H. (2024). The Wandering Atrial Pacemaker. CardioScan. Visit Source.
Mussigbrodt, A., Bethencourt, M. H., Vergier, R., Blidar, M., & Alfie, A. (2025). Leaping to Diagnosis: The Frog Sign as a Key Clue in AVNRT. Clinical Case Reports, 13(3), e70248. Visit Source.
National Heart, Lung, and Blood Institute. (2025). How the Heart Beats. National Institutes of Health. Visit Source.
Nickson, C. (2024). ECG Rhythm Evaluation. Life in the FASTLANE. Visit Source.
Pollack, M. L., Chan, T. C., & Brady, W. J. (2000). Electrocardiographic manifestations: aberrant ventricular conduction. The Journal of Emergency Medicine, 19(4), 363–367. Visit Source.
Prutkin, J. M. (2024). Control of ventricular rate in atrial flutter. UpToDate. Visit Source.
Rawshani, A. (2024). NSTEMI (Non ST Elevation Myocardial Infarction) & Unstable Angina: Diagnosis, Criteria, ECG, Management. The Cardiovascular. Visit Source.
Reeder, G. S. & Kennedy, H. L. (2025). Diagnosis of acute myocardial infarction. UpToDate. Visit Source.
Sattar, Y., & Hashmi, M. F. (2025). Premature Ventricular Complex. In StatPearls. StatPearls Publishing. Visit Source.
Sauer, W. H. (2024). Etiology of atrioventricular block. UpToDate. Visit Source.
Sauer, W. H. (2025). Chronic bifascicular blocks. UpToDate. Visit Source.
Scanlon, A. (2025a). Do Junctional Rhythms Have P Waves?. Cardiovascular Disease Hub. Visit Source.
Scanlon, A. (2025b). How Does Atrial Contraction Occur?. Cardiovascular Disease Hub. Visit Source.
Scanlon, A. (2025c). How Does Myocardial Infarction Cause Ventricular Fibrillation. Cardiovascular Disease Hub. Visit Source.
School of Health Sciences. (n.d.). The U Wave. The University of Nottingham. Visit Source.
Singh, A. (2024). On An ECG Waveform, What Does The P Wave Respresent?. Shanti Nursing Home. Visit Source.
Singh, A. (2025a). How to Use An ECG To Calculate Pulse?. Shanti Nursing Home. Visit Source.
Singh, A. (2025b). Why Is “Ekg” An Acronym for Electrocardiogram?. Shanti Nursing Home. Visit Source.
Soos, M. P., & McComb, D. (2022). Sinus Arrhythmia. In StatPearls. StatPearls Publishing. Visit Source.
Tchou, P., Nemer, D., Saliba, W., Varma, N., Aziz, P., Patel, A., Nakagawa, H., Kanj, M., Hussein, A., Bhargava, M., & Wazni, O. (2023). Junctional Tachycardia. JACC: Clinical Electrophysiology.Visit Source.
U.S. Pharmacist. (2024). Drug-Induced QT Interval Prolongation in Heart Failure Patients. U. S. Pharmacist. Visit Source.
Listen from your pocket or in your car, Apple CarPlay and Android Auto compatible.
Sync Between Devices
Start on your desktop, pickup on your mobile. Never lose your place.
Reinforce Your Learning
Switch between reading and listening to your course or read while you listen!
Enhance Your Experience
Interactive course outline, robust play controls, multiple voices and different playback speed options.
Listen Anywhere
Listen from your pocket or in your car, Apple CarPlay and Android Auto compatible.
Subscribe for Access
Sync Between Devices
Start on your desktop, pickup on your mobile. Never lose your place.
Reinforce Your Learning
Switch between reading and listening to your course or read while you listen!
Enhance Your Experience
Interactive course outline, robust play controls, multiple voices and different playback speed options.
×
Away for now!
We're sorry! All our support agents are unavailable to chat at the moment.
Need Immediate Assistance? Please visit our FAQ section which provides answers to many common inquiries.
Get in Touch Directly via Email If your query is urgent or you'd prefer to reach us directly, we invite you to submit a support ticket through our Contact Us page. Our dedicated support team will review your inquiry and get back to you as soon as possible.
Support Hours Our chat support is typically available Monday to Friday, 9:00 AM - 6:00 PM EST. For support outside of these hours, please use our email contact
Are you sure?
You should NOT select "Remember me for 30 days" if you are on a public or shared computer.